Intro.
In Part 2, we built the data engineering pipeline — real-time CDC from Cloud SQL to BigQuery via Datastream, RFM feature engineering via Dataform, and daily orchestration via Cloud Workflows. By the end of Part 2, mart.customer_features contained 200 customers with 10 ML-ready features, refreshed automatically every day.
In Part 3, we build the Intelligence Layer — where the system actually thinks. Predicting top customers with Vertex AI Random Forest, retrieving brand knowledge via LangChain + Pinecone RAG pipeline, and generating personalized Mother's Day offers with Gemini API — from ML prediction to AI-powered campaign offers. A Random Forest model trained on Vertex AI Colab Enterprise identifies which customers are most likely to buy, with full Explainable AI (XAI) through feature importance analysis. A RAG pipeline built with LangChain and Pinecone vector database grounds the AI in real brand knowledge, solving the LLM hallucination problem. And the Gemini API generates a personalized campaign offer for each high-value customer, selecting the best-selling product from that customer's preferred category and applying segment-based discounts. This is where data becomes decisions.
0. Intelligence Layer Overview
The diagram below shows the full Part 3 intelligence layer. RFM features from Part 2 flow into Vertex AI for ML prediction. Synthetic brand review data is embedded and stored in Pinecone. LangChain connects the predictions, vector retrieval, and Gemini API into a single pipeline that selects the best product for each customer and generates a personalized offer automatically.

Figure 0. Walsh Retail Part 3 — Intelligence Layer Overview (ML + RAG + Gemini)
1. Why Three Layers — ML, RAG, and LLM?
A common shortcut in marketing automation is rules-based targeting: "send a 10% coupon to anyone who spent over $500 last quarter." It works, but it has two fundamental problems. First, it treats all high-spenders identically — a customer who bought once at $500 is handled the same as one who bought 12 times. Second, it produces the same generic message for everyone, which performs poorly when customers expect relevance.
The Walsh Retail AI Agent uses three layers working together to solve both problems:
| Layer | Service | Question it answers |
|---|---|---|
| ML | Vertex AI (Random Forest) | Who is likely to buy this Mother's Day? |
| RAG | LangChain + Pinecone | What do we know about their preferred brands and products? |
| LLM | Gemini API | Which product should we recommend, and what should we say? |
Without the ML layer, we waste budget on customers who would not have bought regardless. Without the RAG layer, the LLM generates fluent but generic or factually wrong offers — a hallucination problem. Without the LLM layer, we are back to templates. All three are necessary.
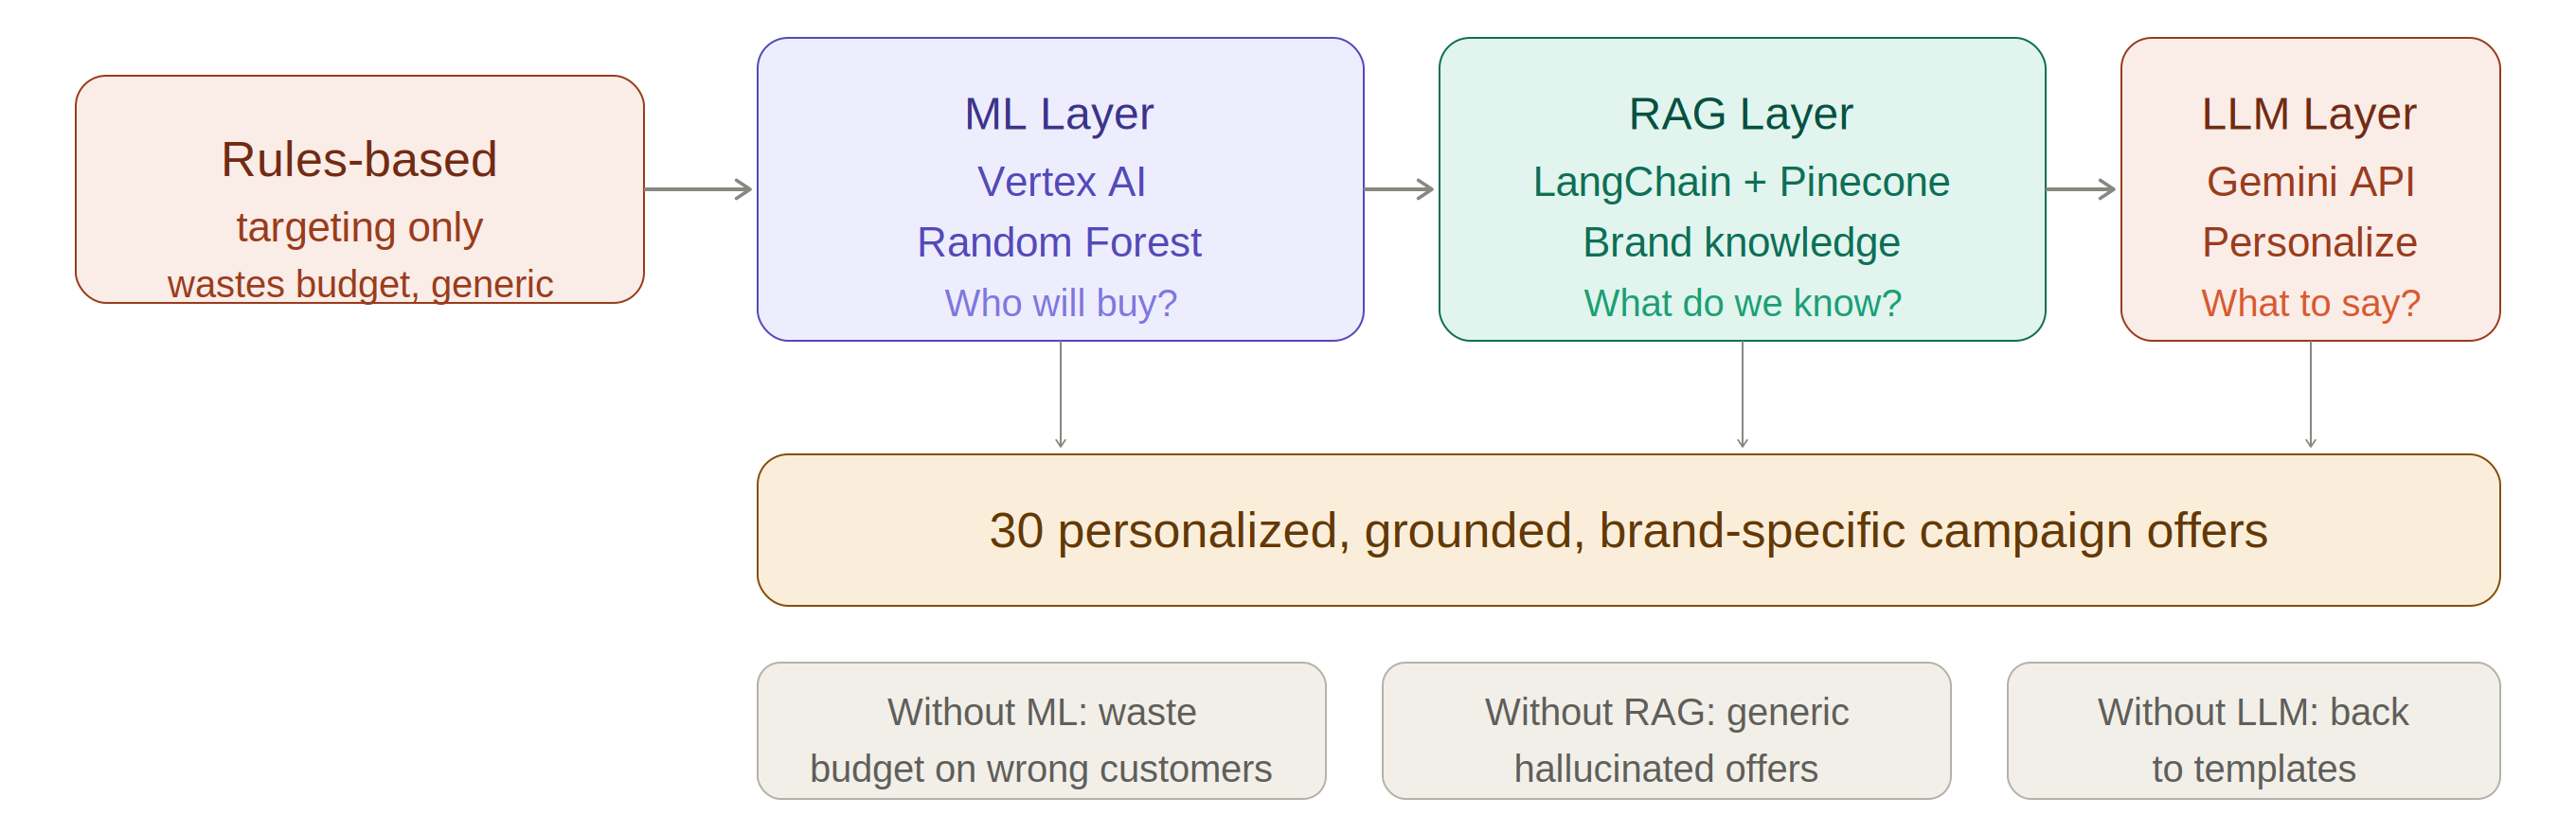
Figure 1.1. Three-layer intelligence stack — each layer solves what the others cannot
2. Vertex AI — Random Forest and Explainable AI
2.1 What Is a Decision Tree?
A Decision Tree is a series of yes/no questions about the data, organized into a branching structure. Each internal node is a question ("Is recency_days < 30?"), each branch is an answer, and each leaf node is a prediction. The diagram below shows how a single tree partitions the feature space into rectangular decision regions — each region corresponds to one set of yes/no answers from root to leaf.
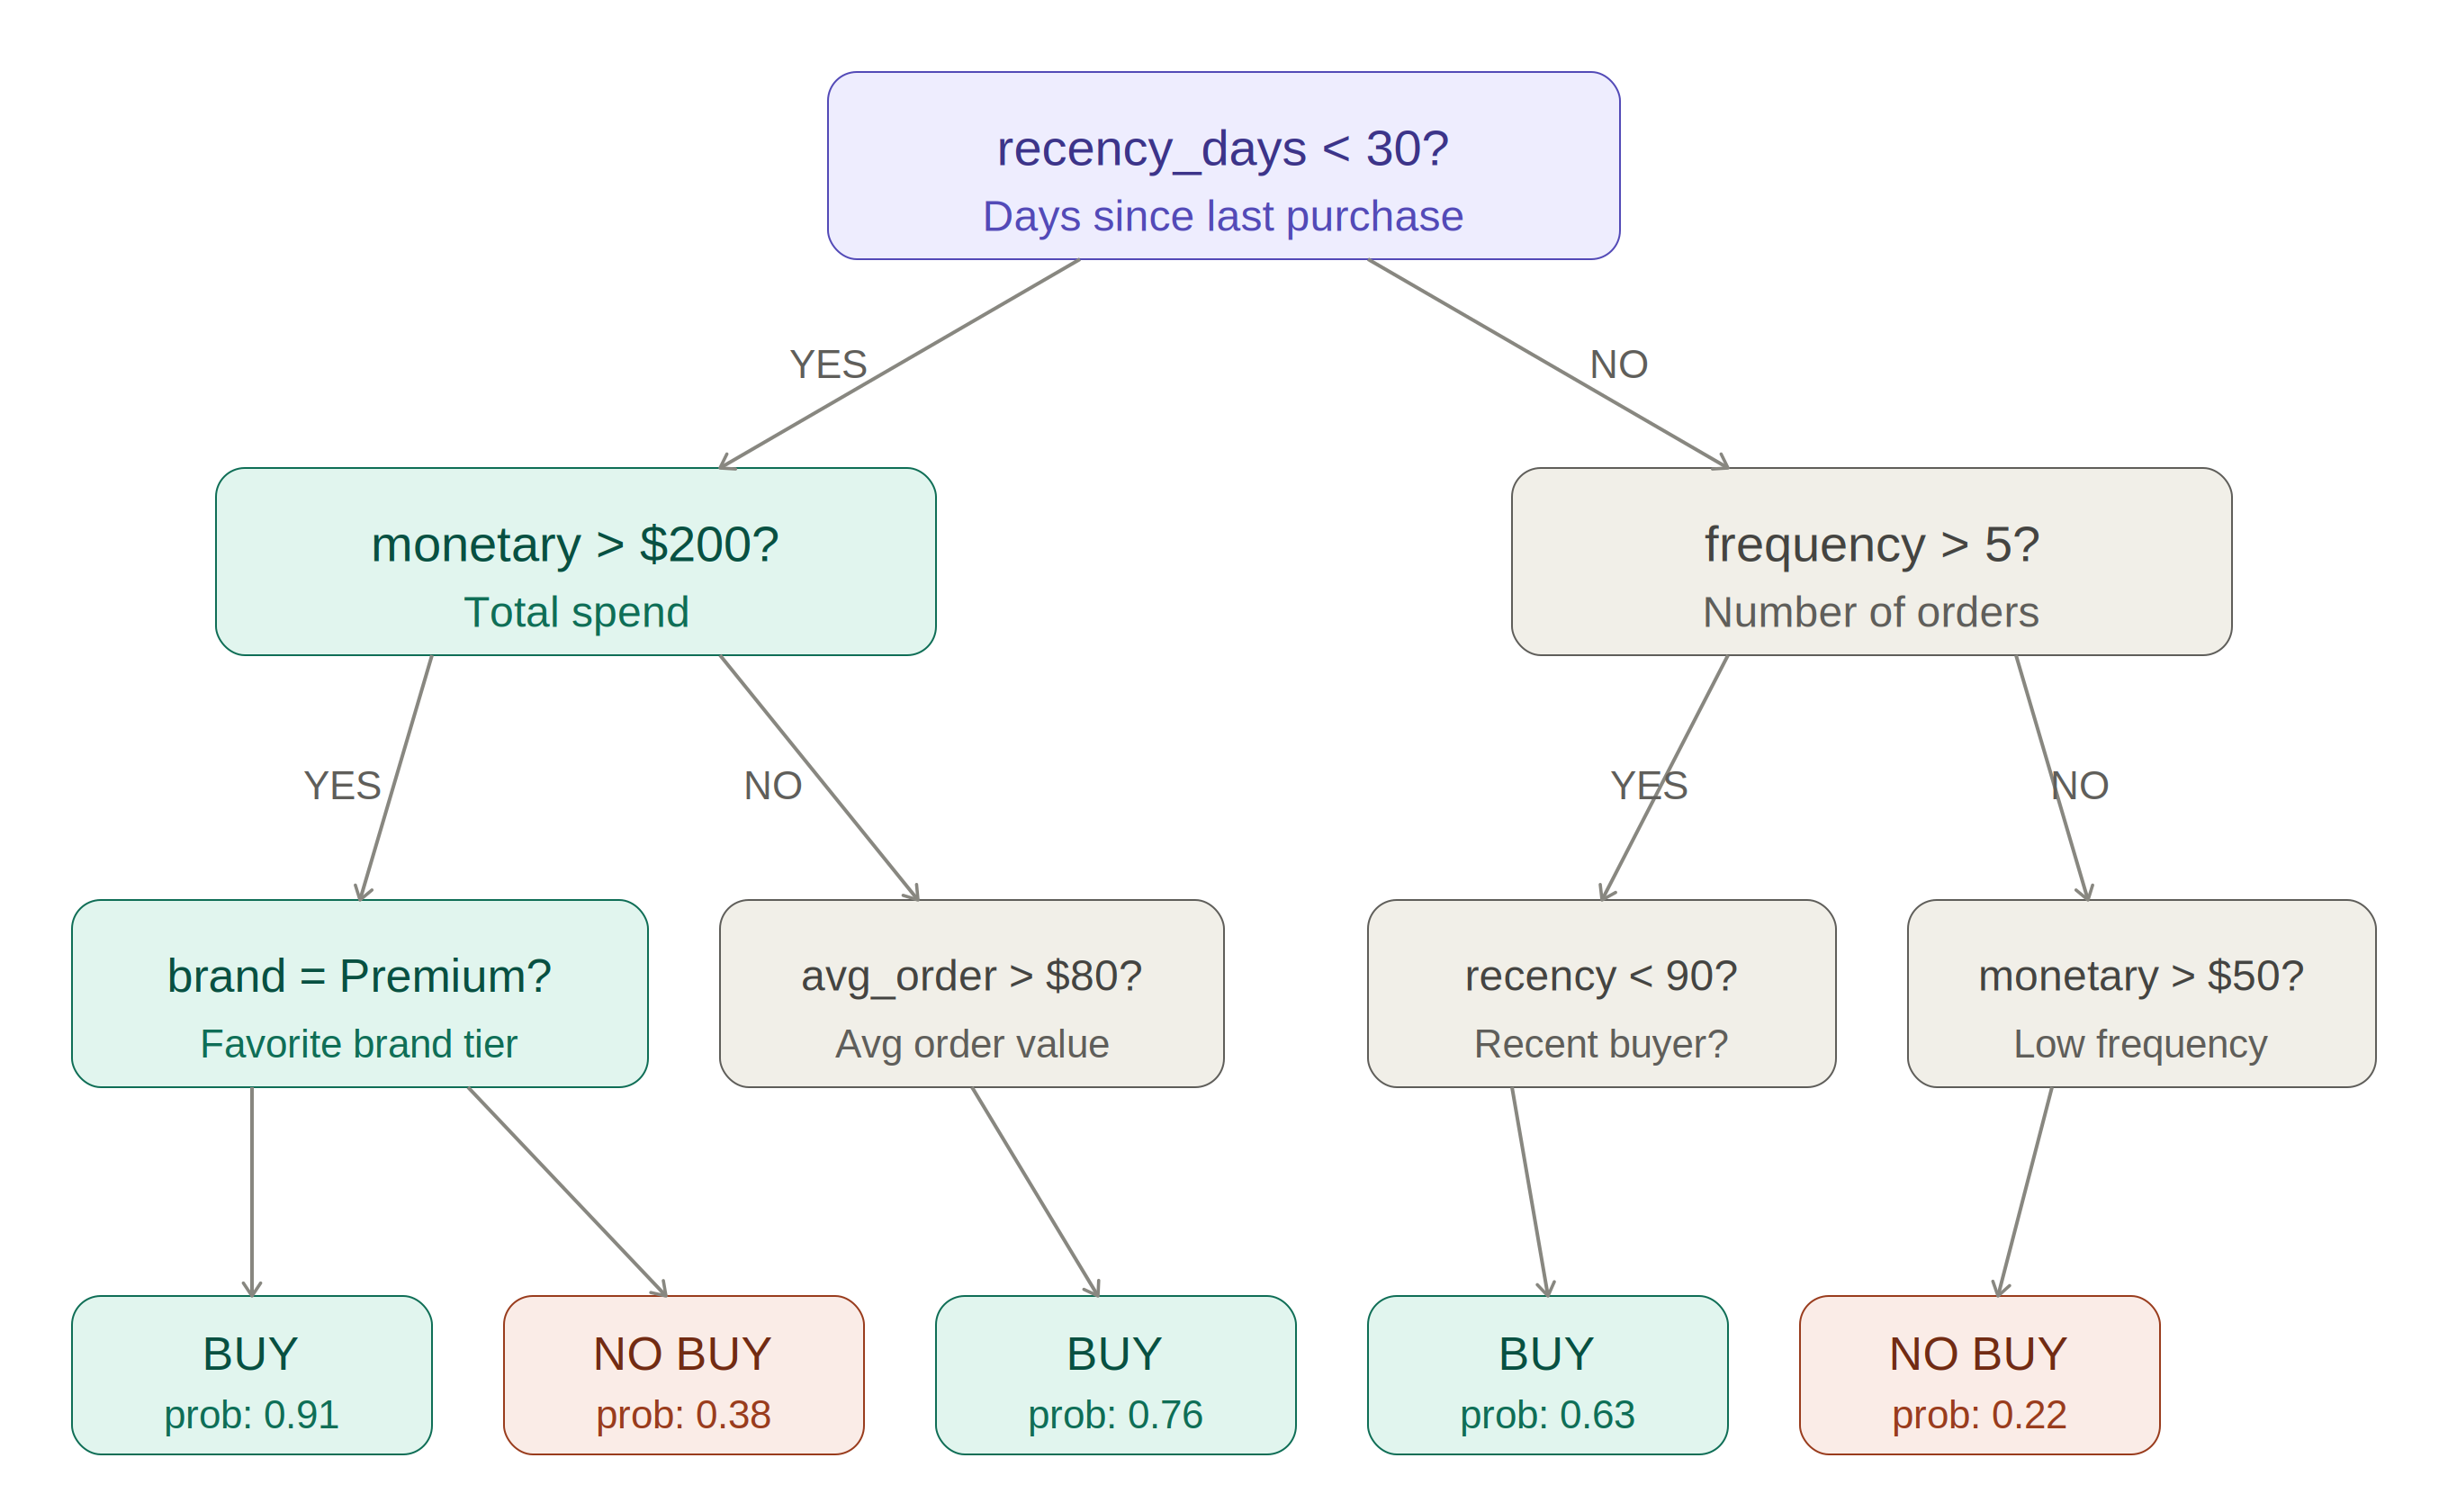
Figure 2.1. A single Decision Tree partitions feature space into axis-aligned rectangular regions (R1–R5)
2.2 Why Random Forest? Feature Space and Nonlinear Boundaries
A single Decision Tree has a fundamental limitation: its splits are always axis-aligned. The resulting decision boundary is a set of rigid rectangles — it struggles to capture the curved, nonlinear patterns that real customer behavior actually follows. Random Forest solves this by building hundreds of trees, each trained on a different random subset of data and features. When their votes are aggregated, the combined boundary becomes smooth and nonlinear, fitting the actual data distribution far more accurately.
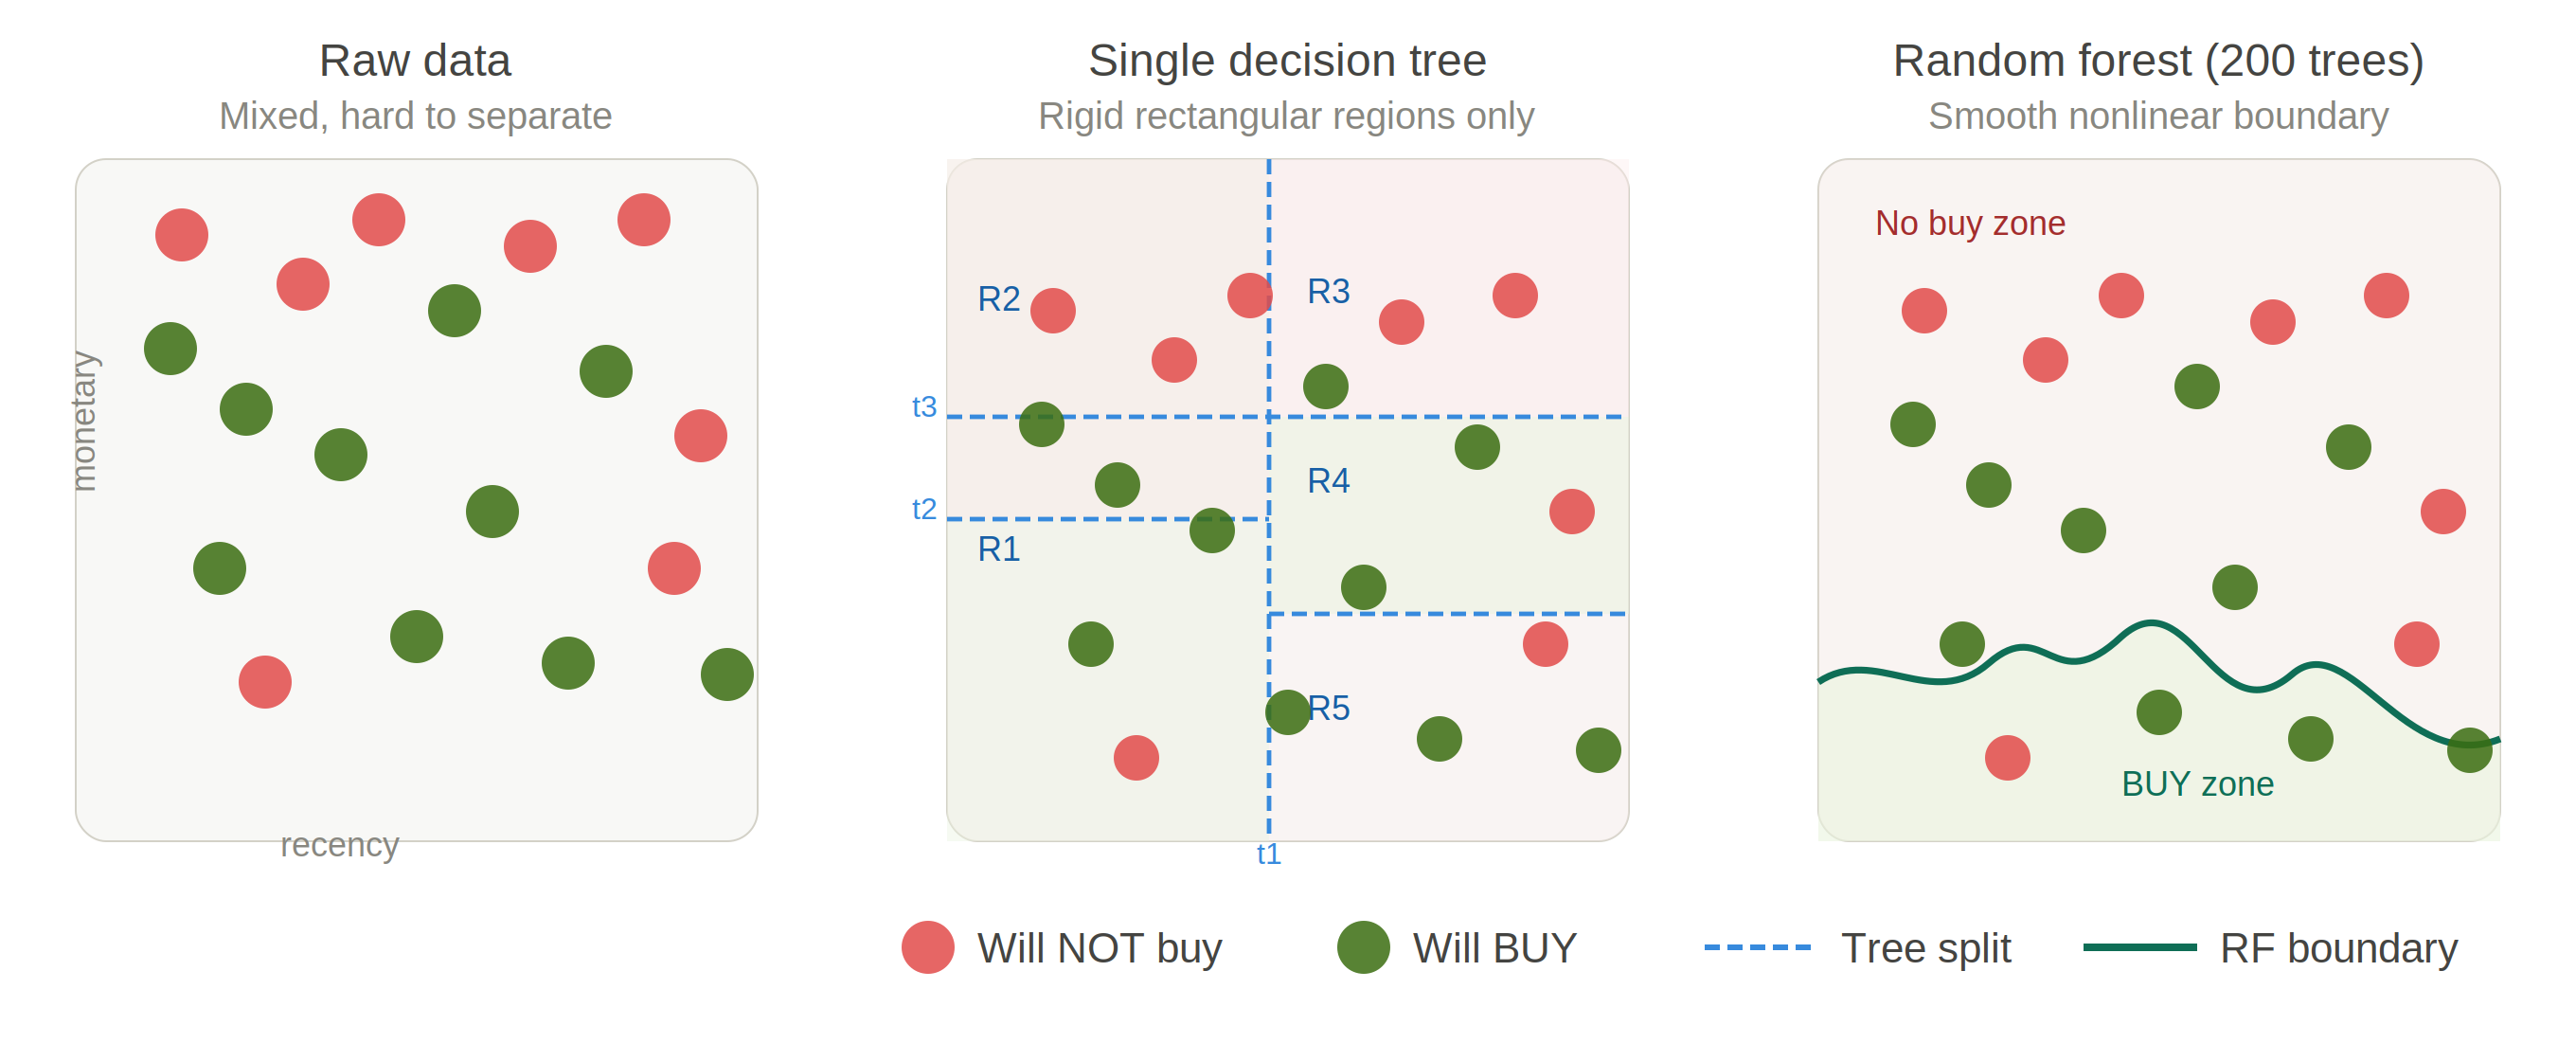
Figure 2.2. Feature space comparison — single tree produces rigid rectangular boundaries; Random Forest ensemble produces a smooth nonlinear boundary
2.3 How Random Forest Works — Two Sources of Randomness
Random Forest introduces randomness at two levels, which is what makes the ensemble diverse and robust. First, each tree is trained on a different bootstrap sample — a random subset of the training data drawn with replacement. Second, at each split, only a random subset of features is considered, not all of them. This means every tree sees different data and makes decisions based on different features — producing 200 genuinely independent learners whose errors cancel out when votes are aggregated.
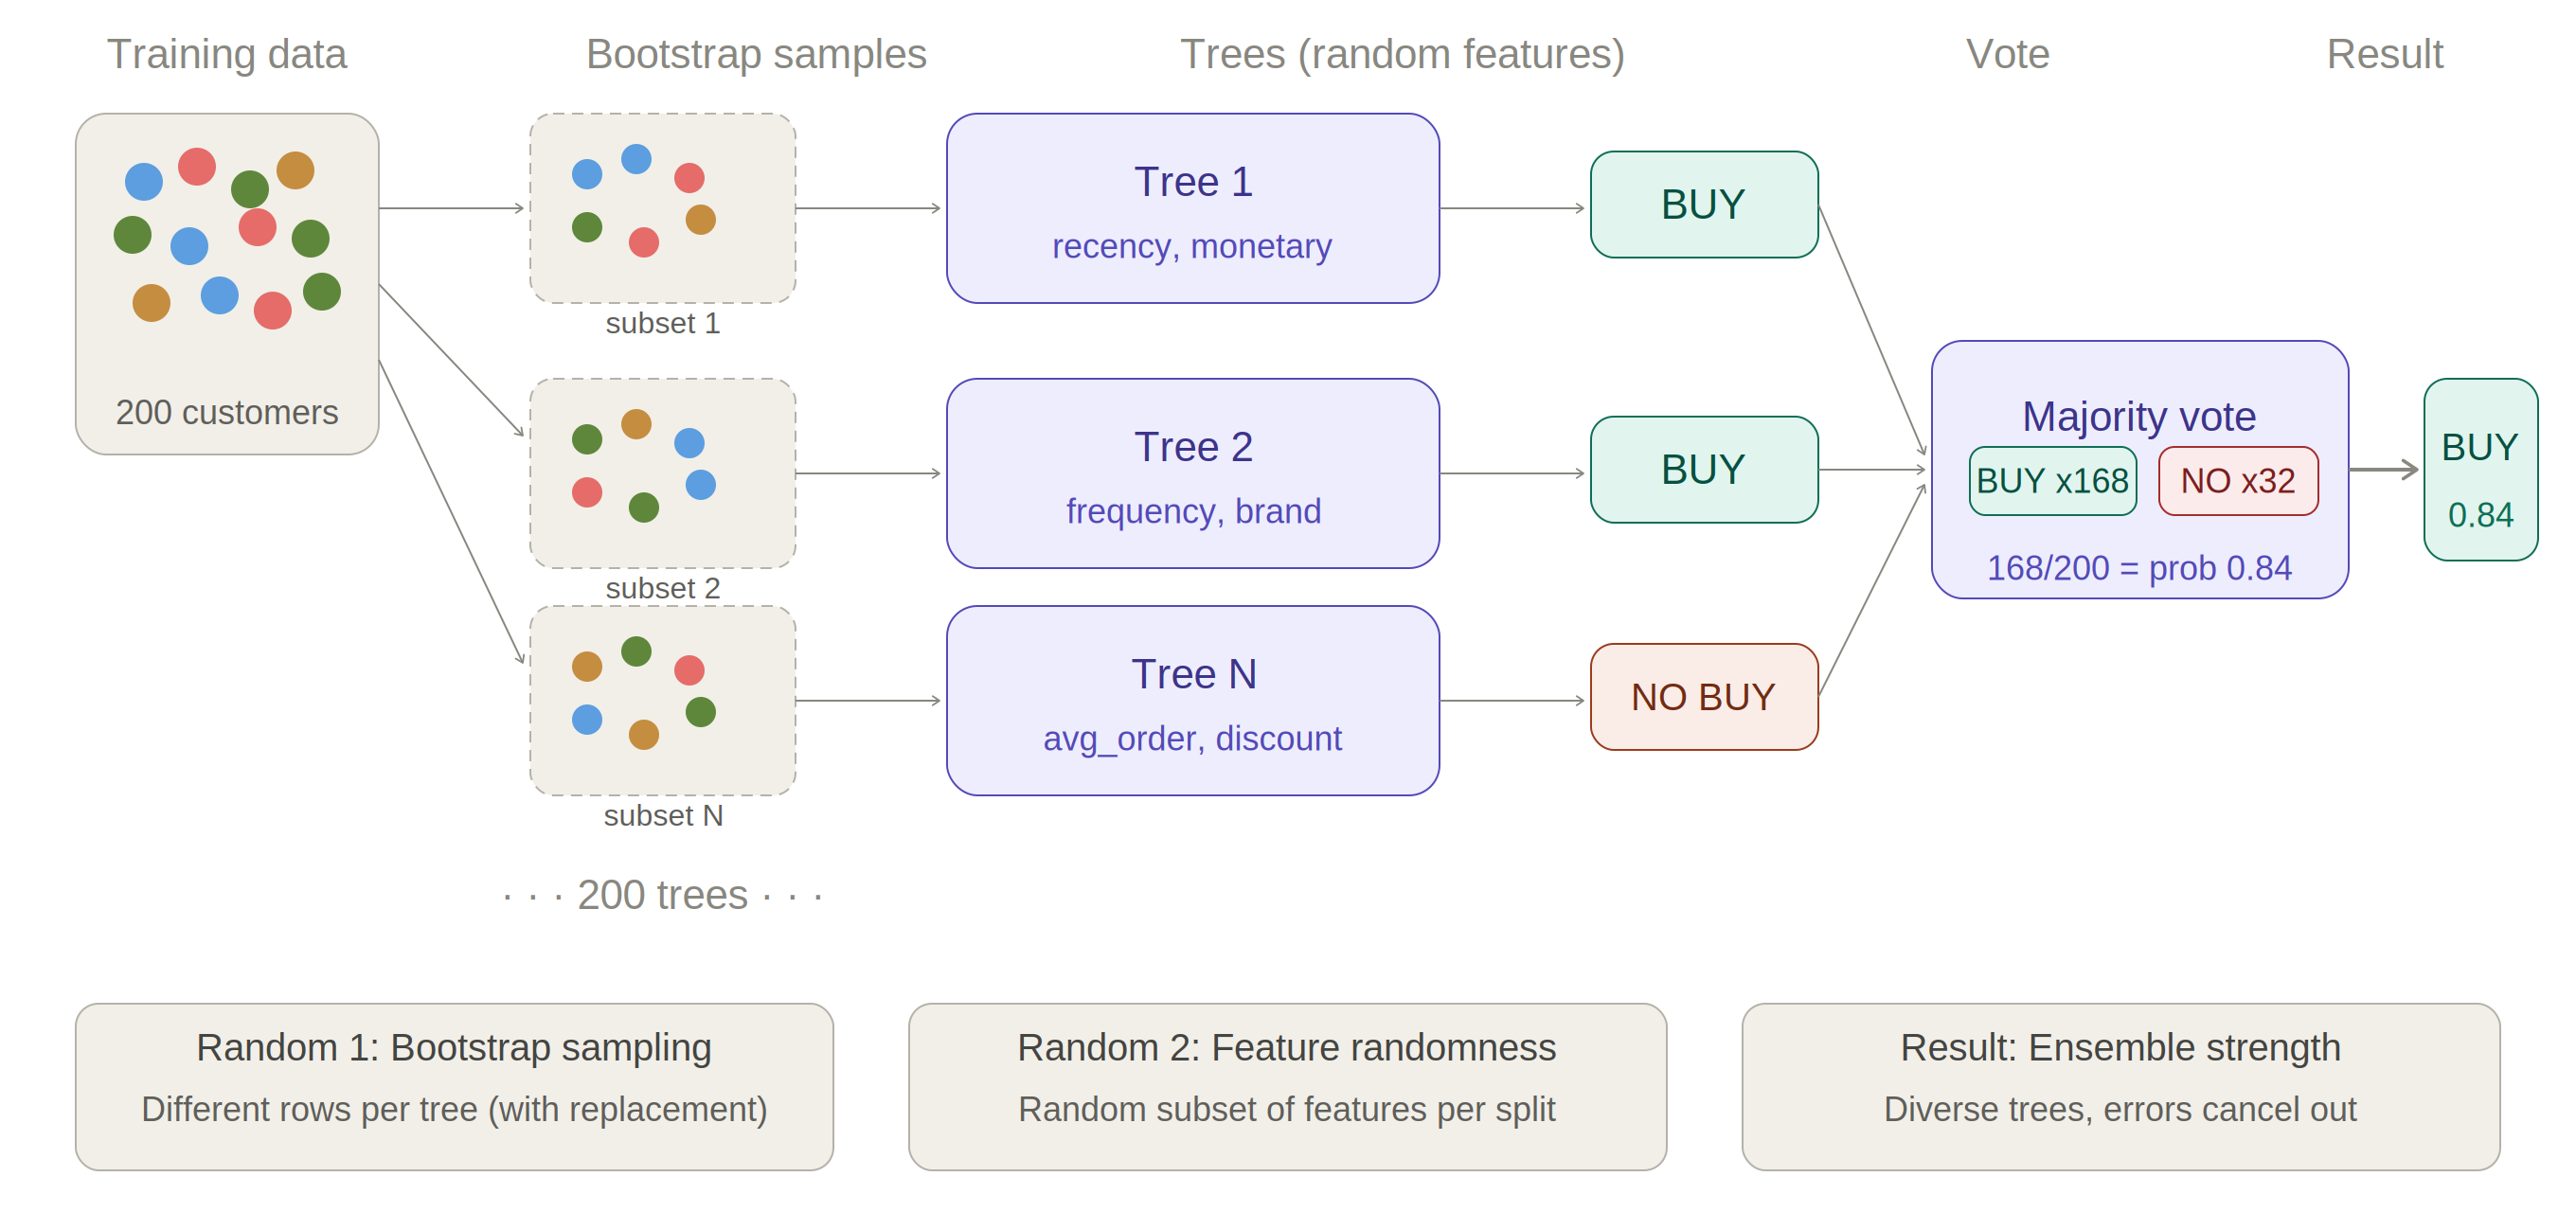
Figure 2.3. Random Forest — bootstrap sampling (random rows) + feature randomness (random columns) = 200 diverse trees, majority vote
2.4 Why Not a Deep Neural Network?
The choice of Random Forest over a deep neural network was deliberate, based on two constraints specific to this project.
The first is data volume. With 200 training samples, a DNN would overfit immediately — it would memorize the training data perfectly and fail completely on new customers. Random Forest's bootstrap sampling provides built-in variance reduction that makes it robust at this scale. DNNs typically need tens of thousands of samples to generalize reliably.
The second constraint is more important in real-world production systems: interpretability. In practice, model predictions must be justifiable to business stakeholders. When a campaign targets a specific customer, the marketing team needs to understand why — not just accept a black-box probability score. Random Forest answers this directly through feature importance analysis.
| Criterion | Random Forest | Deep Neural Network |
|---|---|---|
| Training data required | Hundreds of rows | Tens of thousands+ |
| Overfitting risk (small data) | Low — bootstrap reduces variance | High — requires heavy regularization |
| Interpretability | Feature importance scores | Black box — not interpretable |
| Tabular data performance | Strong | Typically weaker than tree methods |
| Stakeholder explainability | Yes — quantified feature contribution | No — cannot explain individual decisions |
2.5 Explainable AI (XAI) — Why Interpretability Is Now a Production Requirement
The interpretability advantage of Random Forest connects to one of the most important trends in production ML: Explainable AI (XAI). For years, the industry optimized purely for accuracy — the best model was the one with the lowest error rate, regardless of how it worked. That approach is no longer sufficient.
In regulated industries, model decisions must be auditable. In finance, regulations require that automated decisions affecting individuals can be explained. In healthcare, a physician will not act on a model's recommendation without understanding the reasoning. In marketing, a business team will not approve a campaign targeting strategy they cannot verify. The pattern is consistent across domains: a model that cannot explain itself does not get deployed in production, regardless of its accuracy on the test set.
In 8+ years of working on production ML systems across retail, manufacturing, and public sector, the most common reason a well-performing model never reached deployment was not accuracy — it was interpretability. Business stakeholders and compliance teams need to understand and trust the model's reasoning. A Random Forest with AUC 0.84 that can show "recency accounts for 38% of the prediction" will get approved. A neural network with AUC 0.87 that cannot explain individual decisions often will not. This is why Random Forest remains the industry standard for tabular data classification in production environments where decisions must be justified.
Random Forest addresses XAI directly through feature importance analysis. After training, the model produces a ranked score for each input feature — quantifying exactly how much each RFM dimension contributed to purchase probability predictions across the entire dataset. This is not a post-hoc approximation. It is a native property of the ensemble: the importance score reflects how often and how effectively each feature was used to reduce prediction error across all 200 trees.
2.6 Vertex AI Colab Enterprise — Setup and Execution
The training runs on Vertex AI Colab Enterprise — a serverless notebook environment with native BigQuery integration. No instance provisioning or infrastructure setup is required. The workflow reads mart.customer_features from BigQuery, trains the Random Forest classifier, evaluates on a held-out test set (80/20 split), and writes the top 30 predictions to mart.ml_prediction.
Vertex AI offers two notebook environments: Colab Enterprise and Workbench. For this project, Colab Enterprise was selected because it is serverless (no instance cost when idle), has native BigQuery connectivity with automatic authentication, and is well-suited for the scale of this analysis. Workbench is the right choice when a production Docker container environment, GPU access, or OS-level customization is required — for example, when packaging the final model into a Cloud Run container for automated deployment.
Navigation: GCP Console > Vertex AI > Colab Enterprise > + New notebook > Enter prompt in Gemini panel > Accept & Run
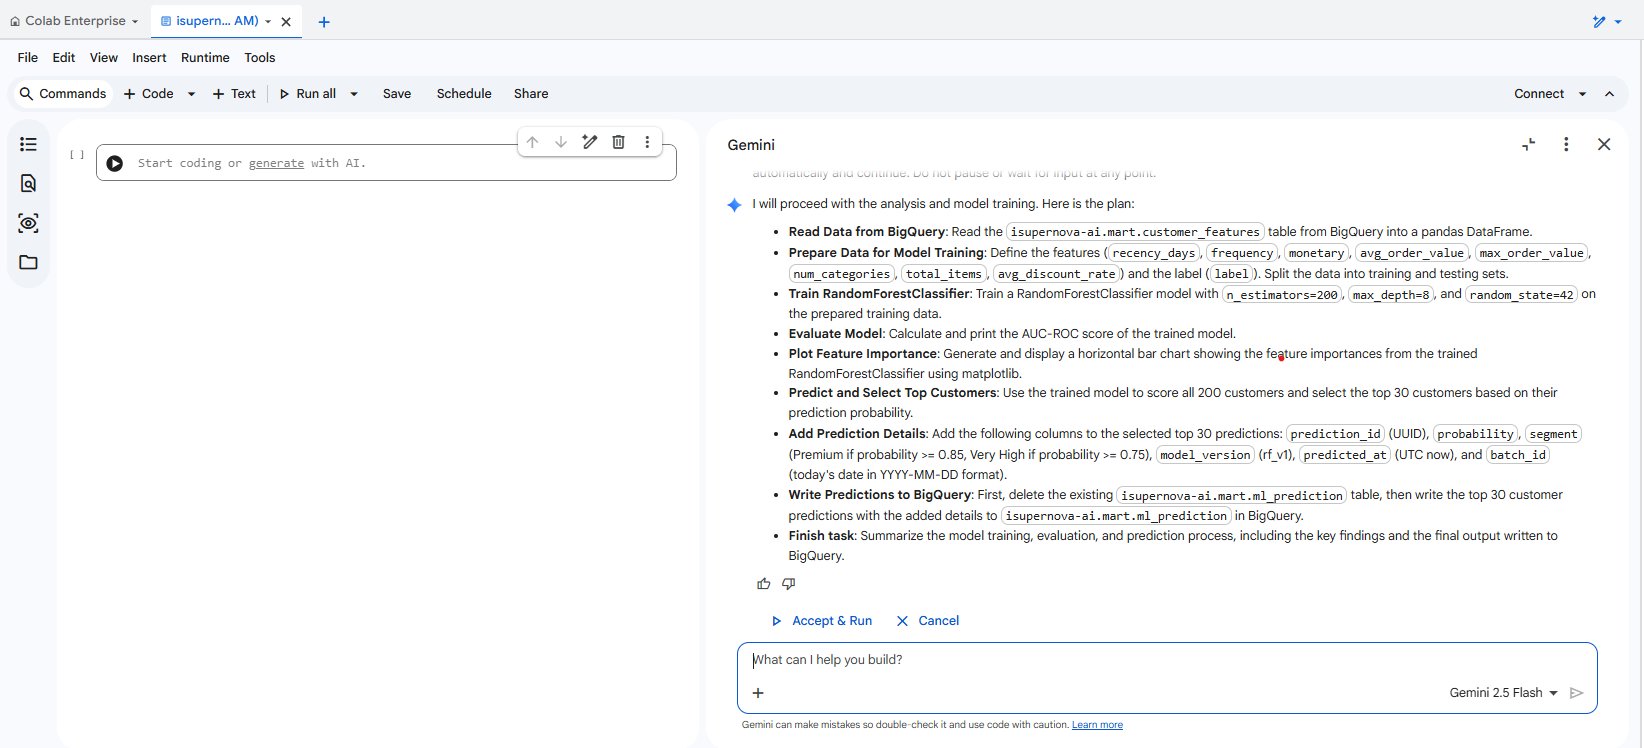
Figure 2.4. Vertex AI Colab Enterprise — Gemini generates and executes the full Random Forest training pipeline
2.7 Feature Importance
After training, the model produces feature importance scores. recency_days ranks highest, followed by max_order_value, avg_discount_rate, and monetary. This aligns with marketing intuition: customers who bought recently and spent more are much more likely to buy again for Mother's Day. The feature importance chart is the direct answer to the business question "why was this customer selected?" — and also serves as a model quality check. A model that produces counterintuitive importance scores would warrant investigation before deployment.

Figure 2.5. Feature importance — recency_days is the strongest predictor of Mother's Day purchase behavior
2.8 Prediction Results — mart.ml_prediction
The trained model scores all 200 customers. The top 30 by purchase probability are selected as campaign targets and written to mart.ml_prediction. Customers scoring 0.85 or above are classified as Premium segment and receive a 20% discount; those scoring 0.75 to 0.85 are classified as Very High and receive 15%.
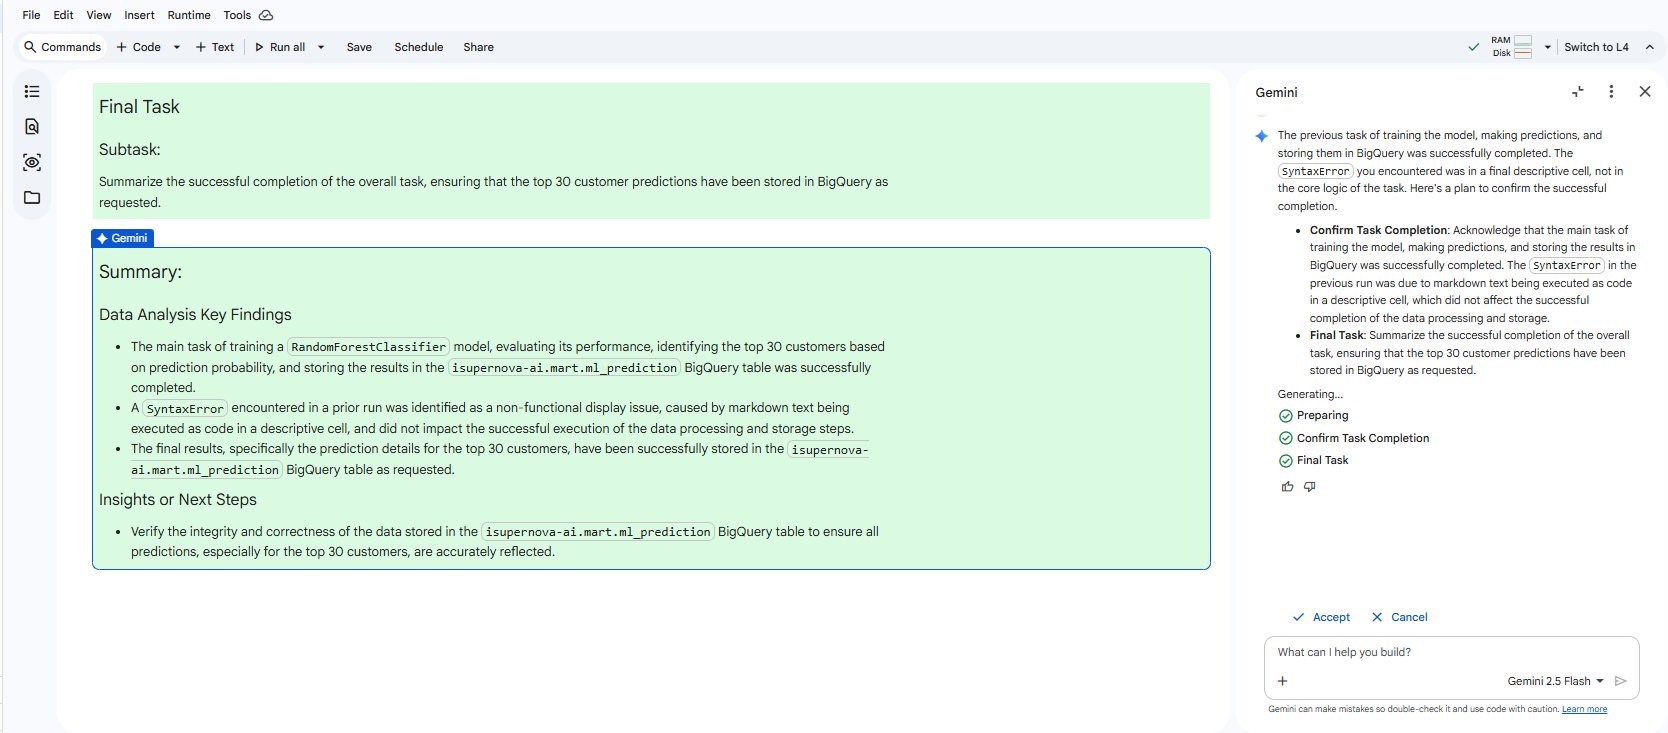
Figure 2.6. BigQuery mart.ml_prediction — top 30 customers with purchase probability and segment classification
3. RAG Pipeline — LangChain + Pinecone
3.1 Why RAG? The Hallucination Problem
After identifying the top 30 customers, the question becomes: what do we say to them, and which product should we recommend? Sending a customer profile directly to Gemini and asking it to write an offer produces a specific failure mode: hallucination. Gemini has no knowledge of Walsh Retail's actual product catalog, brand relationships, or customer language. It will generate confident, fluent text that is factually invented — generic praise that could apply to any retailer.
Retrieval-Augmented Generation (RAG) fixes this by adding a retrieval step before generation. Instead of relying on what the model learned during training, RAG retrieves relevant facts from an external knowledge base at inference time and passes them as grounding context. The LLM generates text based on retrieved evidence, not parametric memory.
Fine-tuning a foundation model on company-specific data costs significant GPU resources and produces a model whose knowledge is fixed at training time. RAG achieves the same customization effect at inference time by injecting company-specific knowledge directly into the prompt — at near-zero cost and with knowledge that can be updated instantly by adding new documents to the vector database. This is why RAG has become the production standard for enterprise LLM customization: a general-purpose LLM that behaves like a domain expert, without retraining.
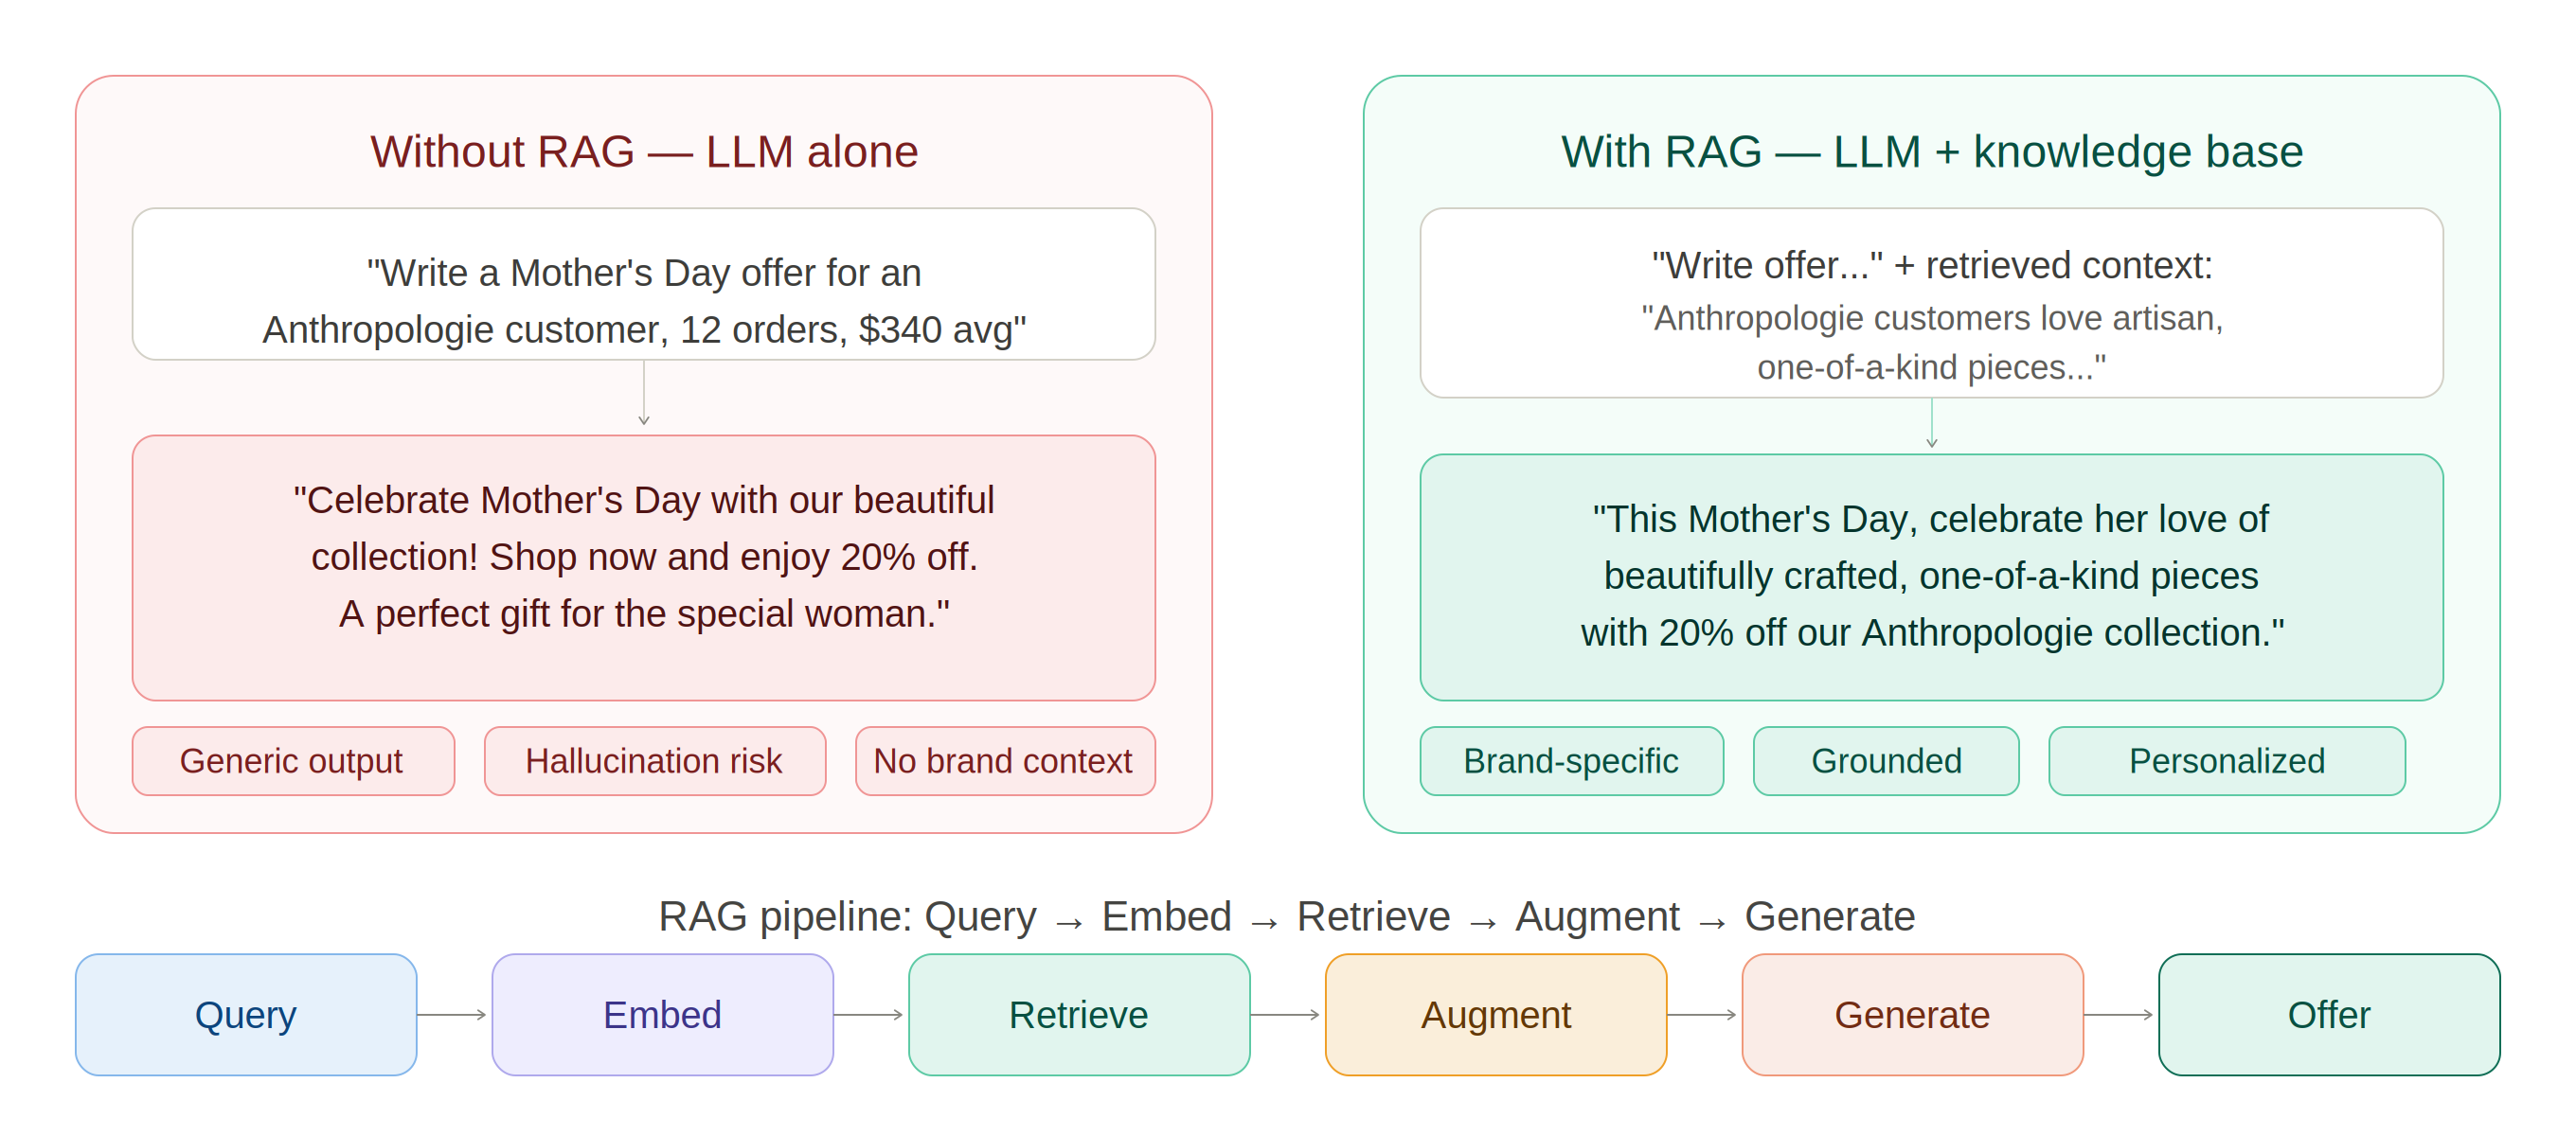
Figure 3.1. Without RAG: generic hallucinated offer. With RAG: brand-specific, grounded offer — same LLM, different context
3.2 Brand Review Knowledge Base
The RAG knowledge base is built from synthetic customer reviews generated for the brands represented in the Walsh Retail product catalog. Each review is structured with brand name, product name, category, review text, rating, and sentiment — 500 reviews covering 11 brands across Jewellery, Clothing, Food & Gourmet, Watches, and Bags categories.
The brand reviews used in this RAG pipeline are synthetically generated for demonstration purposes, due to legal restrictions on scraping or redistributing actual customer reviews from e-commerce platforms. In a production deployment, the knowledge base would be built from the complete vendor catalog — collecting real customer reviews for every active brand across all product categories. The synthetic data was generated to reflect realistic review language, sentiment distribution (70% positive, 20% neutral, 10% negative), and Mother's Day gift context.
3.3 Pinecone Vector Database — Setup
A regular database finds records through exact keyword matching — if the query contains "jewellery" and the record contains "necklace", there is no match. A vector database solves this by converting text into high-dimensional numerical vectors that capture semantic meaning. Two pieces of text with similar meaning produce vectors that are close together in vector space, regardless of the actual words used. This is what makes RAG retrieval powerful: a query about "Mother's Day gift ideas" can retrieve brand reviews that mention "perfect present" or "she loved it" — semantically related content that a keyword search would miss entirely.
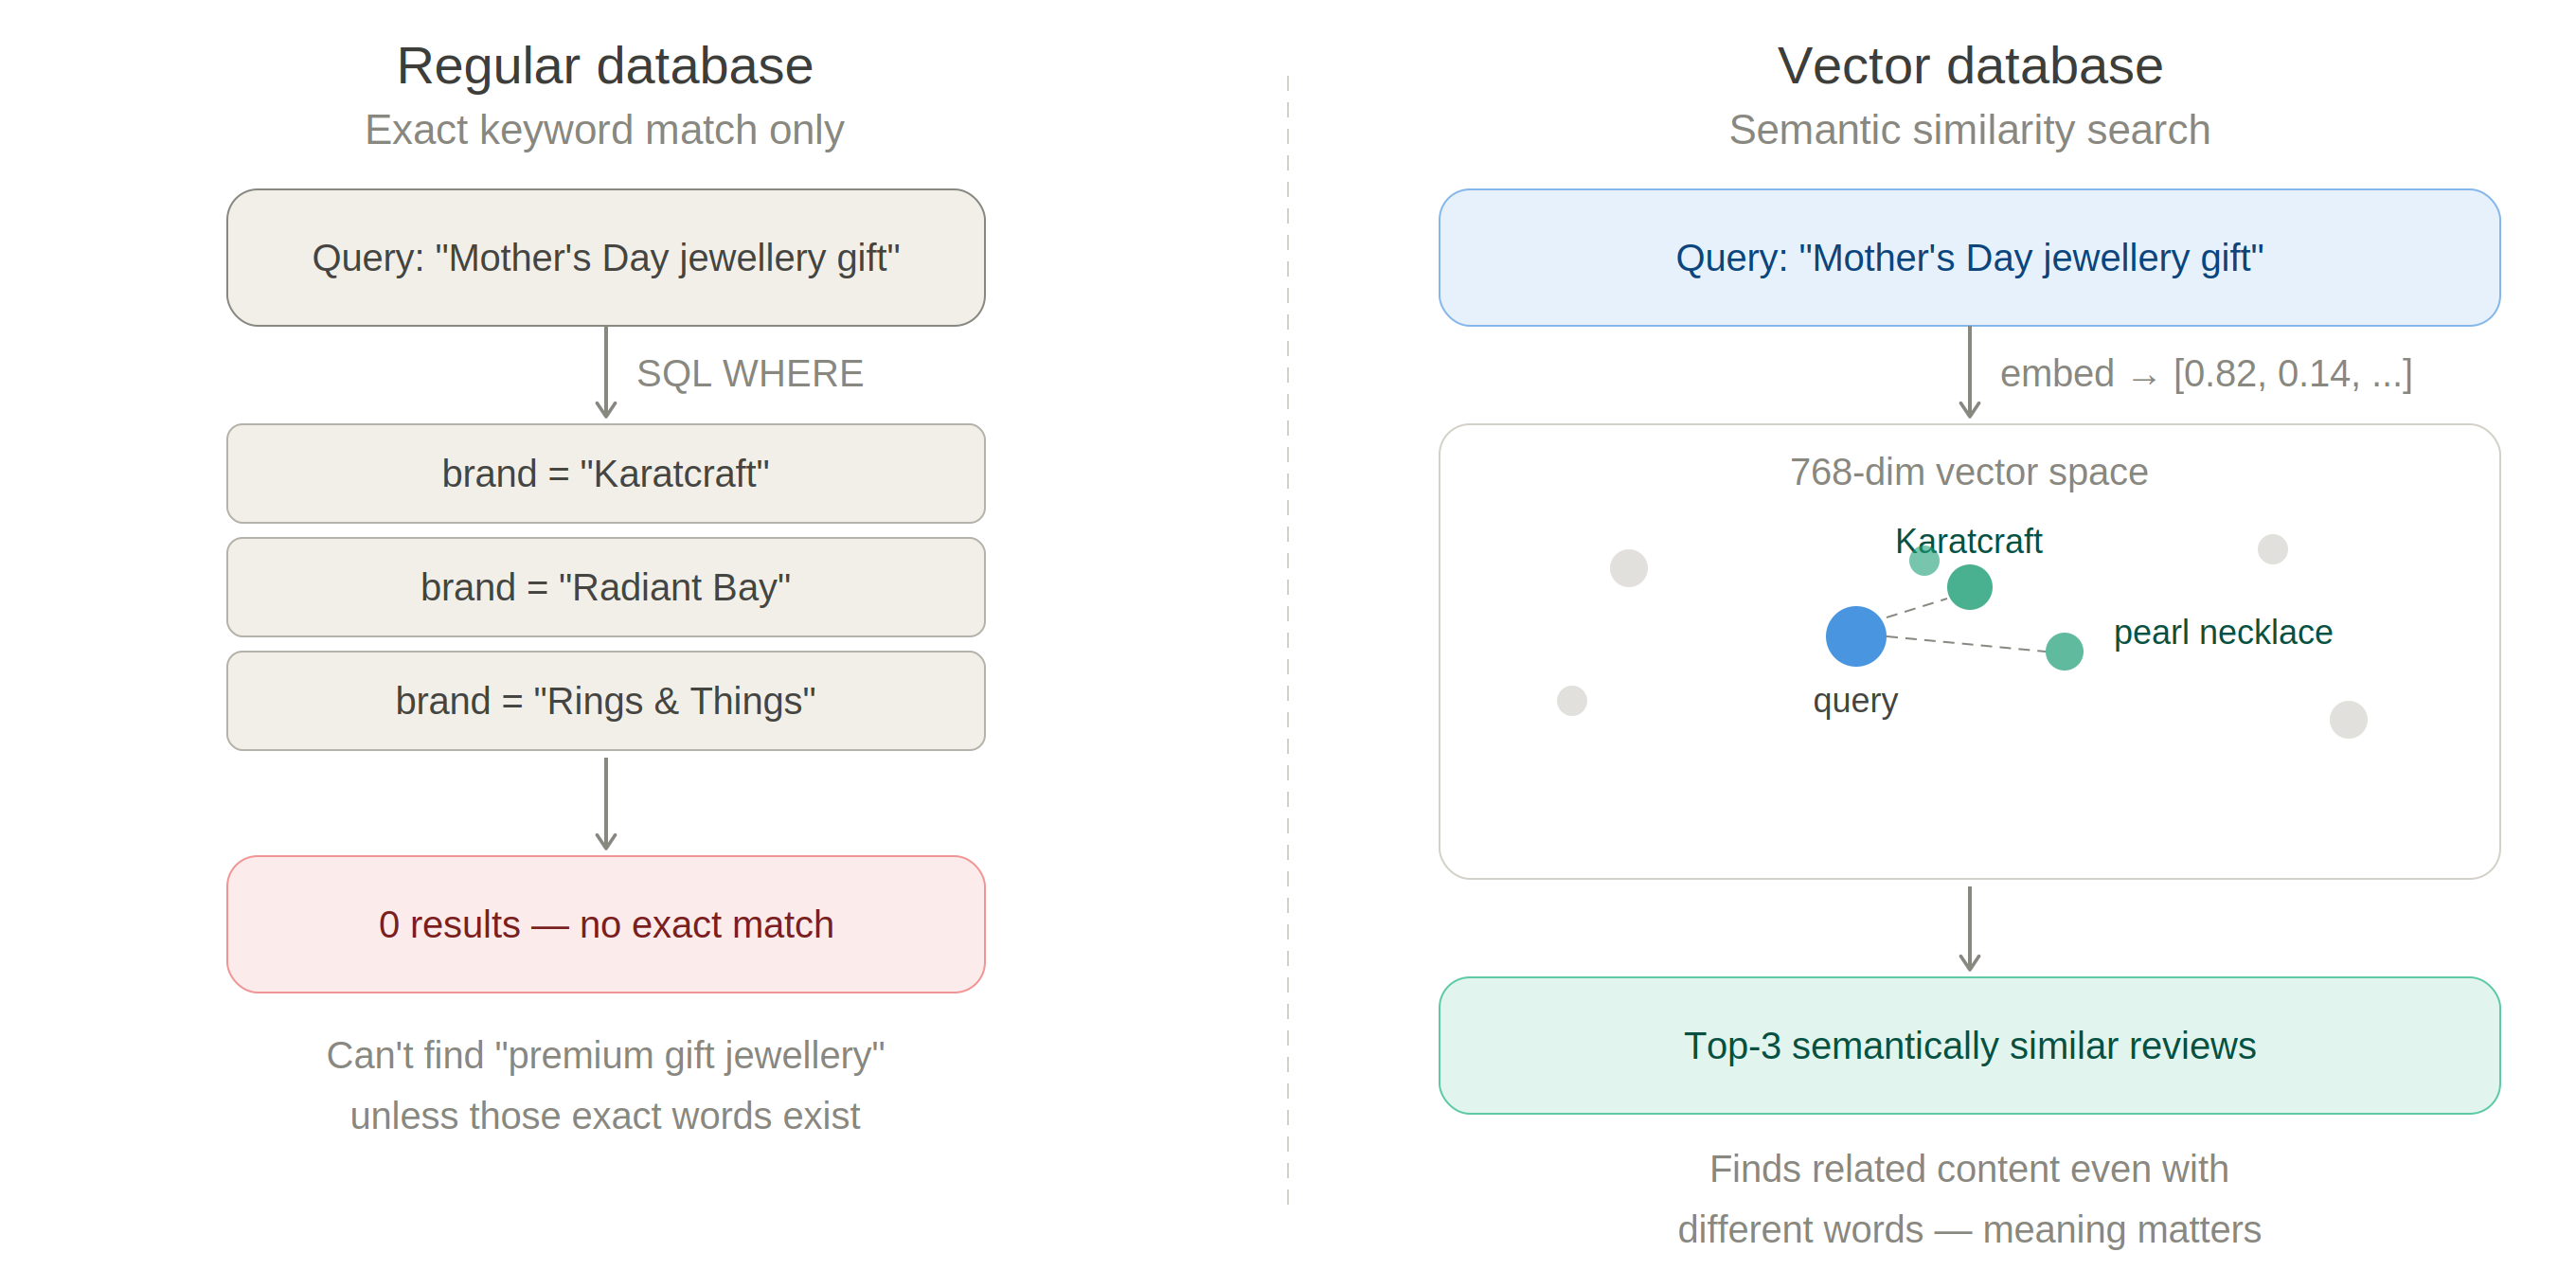
Figure 3.2. Regular DB vs Vector DB — keyword matching vs semantic similarity search in embedding space
Each review is embedded using Vertex AI's text-embedding-004 model, producing a 768-dimensional vector. These vectors are stored in a Pinecone serverless index configured with cosine similarity. Pinecone was selected over self-hosted alternatives (Weaviate, ChromaDB) for two reasons: it eliminates infrastructure management entirely, and it is the vector database most commonly referenced in production RAG architectures — directly relevant for portfolio positioning.
Navigation: pinecone.io > Console > Create index > Name: walsh-brand-reviews > Dimensions: 768 > Metric: cosine > Serverless (AWS us-east-1) > Create
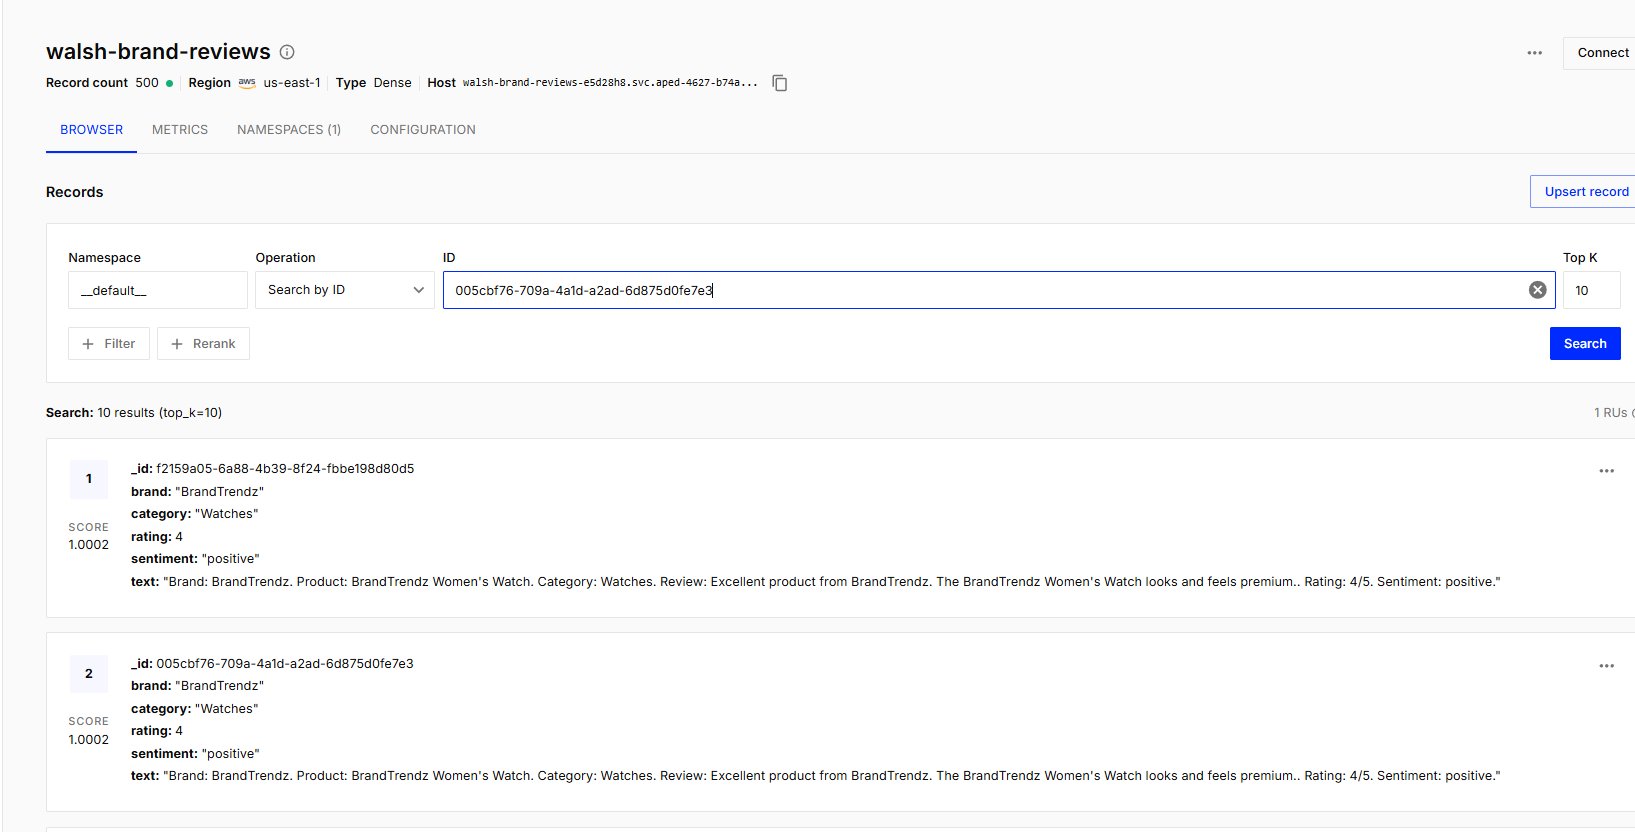
Figure 3.2. Pinecone — walsh-brand-reviews index, 500 vectors, 768-dim cosine similarity, serverless
3.4 LangChain RAG Chain — How It Connects
LangChain connects embedding, retrieval, and generation into a single chain. Without LangChain, each step requires a separate API call with manual glue code connecting them. With LangChain, the entire retrieve-augment-generate sequence is expressed as a single composable chain: retriever | prompt | llm. Swapping the embedding provider or LLM requires changing one line, not rewriting the pipeline.
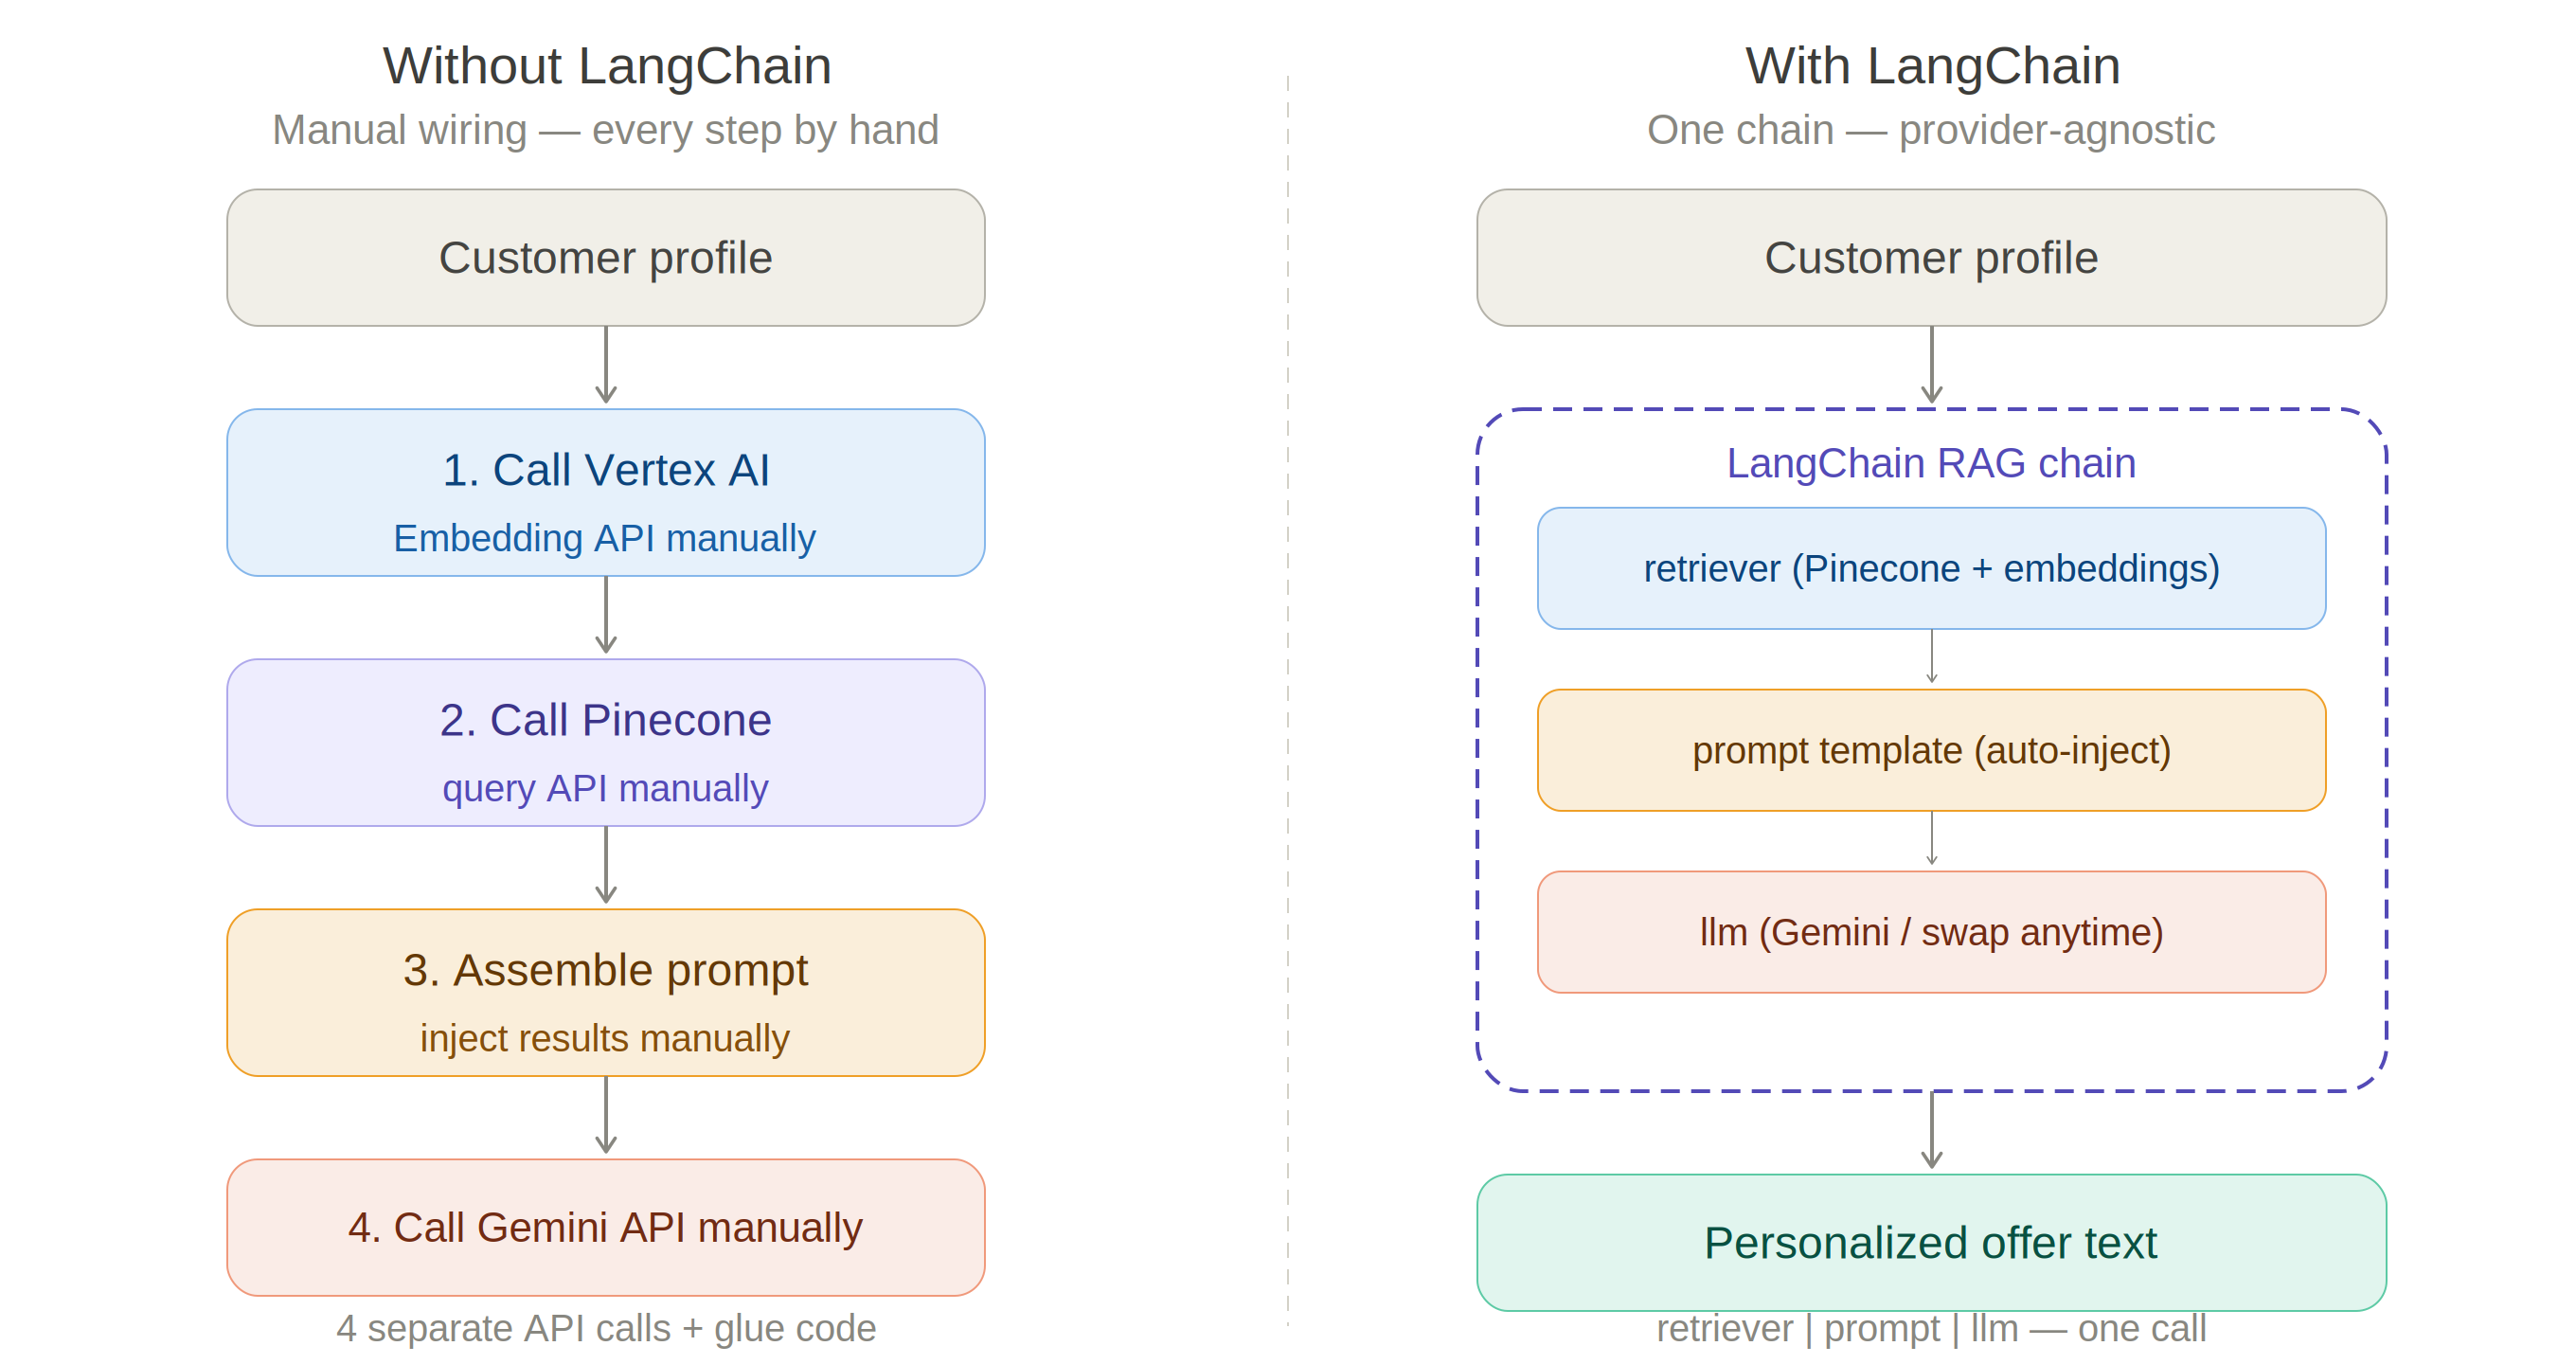
Figure 3.3. Without LangChain: 4 manual API calls with glue code. With LangChain: one composable chain, provider-agnostic
Given a customer profile and preferred category, the chain retrieves the top 3 most similar brand review passages from Pinecone, injects them into a structured prompt along with the top 5 best-selling products in that category, and passes the complete context to Gemini. The LLM then selects the most suitable product and writes a personalized offer.
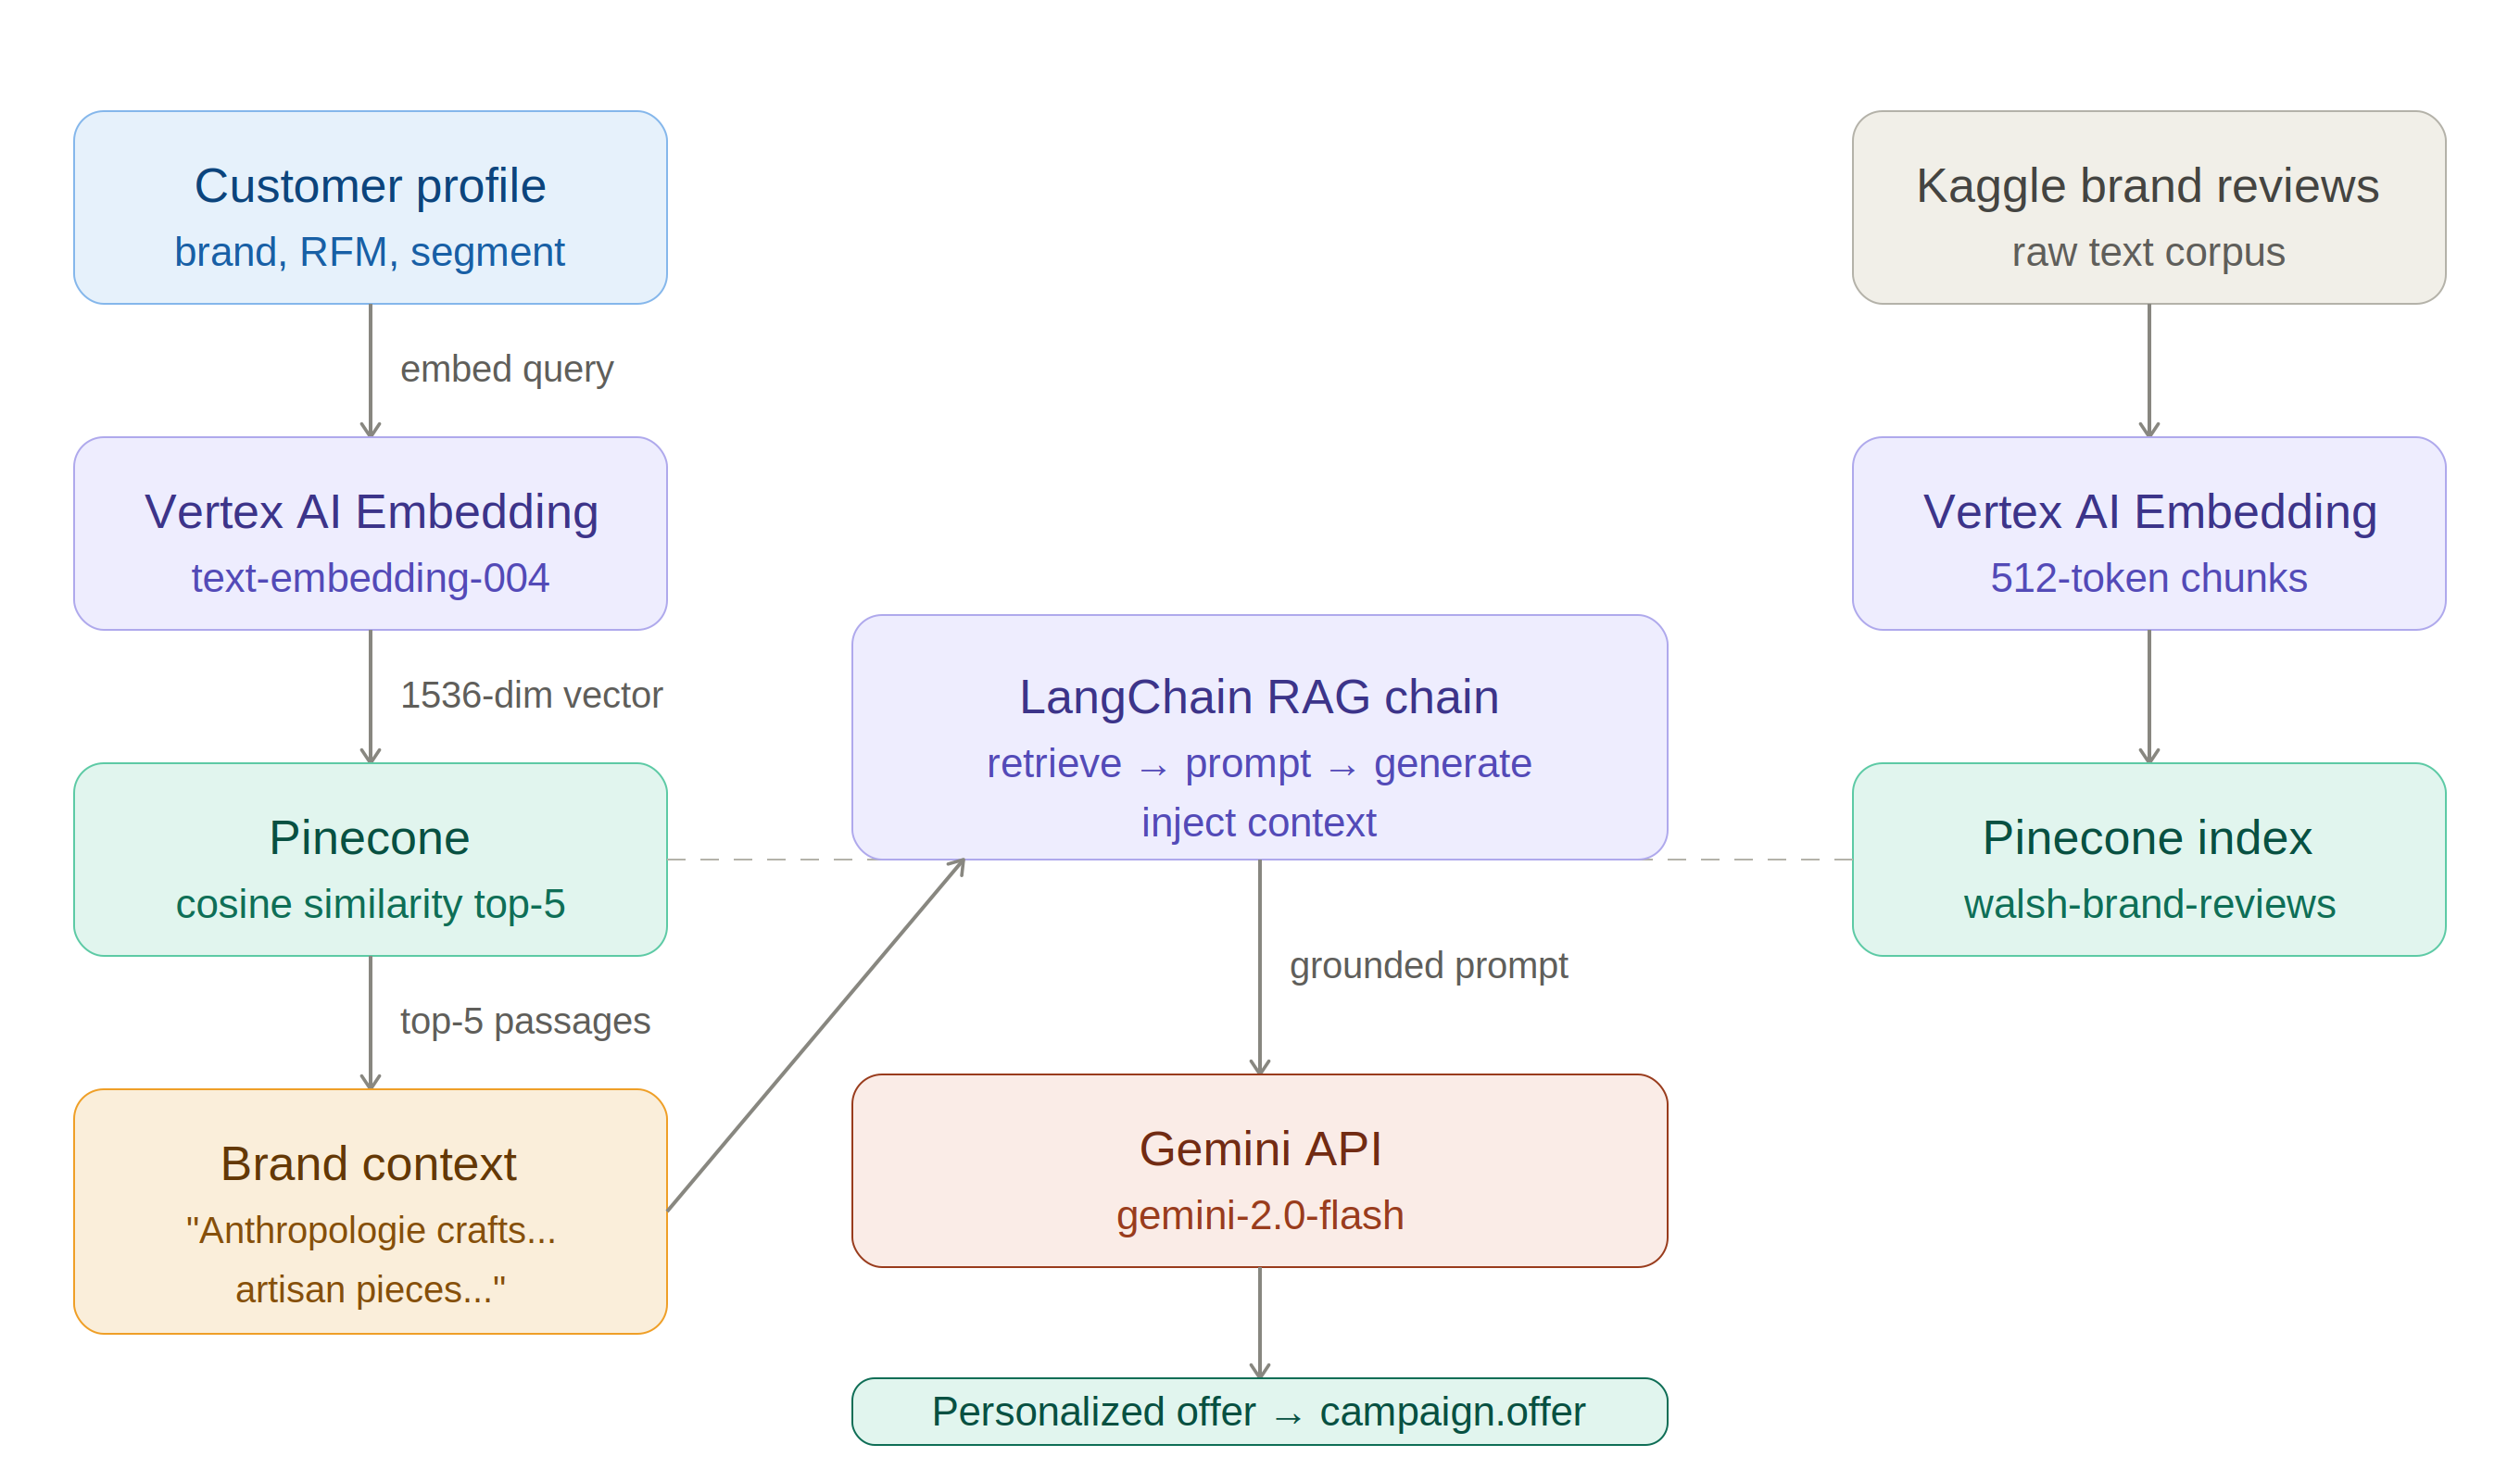
Figure 3.4. Full RAG pipeline — Query → Embed → Pinecone retrieval → Prompt injection → Gemini → Offer
Two things to watch during setup. First, the prompt must explicitly instruct Gemini to select only from the provided product list and use only the provided brand context — without this instruction, the model may invent products or blend retrieved facts with hallucinated details. Second, the discount rate must be injected into the prompt by segment, so the LLM includes the correct offer in the message.
You could call the Vertex AI Embedding API and Gemini API directly without LangChain. LangChain adds value here in two specific ways: it handles the retriever-to-prompt context injection automatically, and it provides a standard interface that decouples the embedding provider from the generation model. Swapping Vertex AI embeddings for OpenAI embeddings, or Gemini for another LLM, requires changing one line — not rewriting the pipeline. For production systems where provider flexibility matters, this abstraction is worth the dependency.
4. Gemini API — Product Selection and Offer Generation
4.1 Offer Generation Logic
The offer generation follows the same logic used in production retail marketing systems. First, the customer's preferred product category is identified from their full order history — the category they have purchased most frequently. Second, the top 5 best-selling products in that category are retrieved from the Walsh Retail product catalog, ranked by total units sold. This data-driven product selection is a proxy for the merchandising team's vendor-negotiated campaign product list in a real production system. Third, the customer profile, product list, RAG brand context, and assigned discount rate are passed to Gemini, which selects the most suitable product and writes a personalized offer message under 60 words.
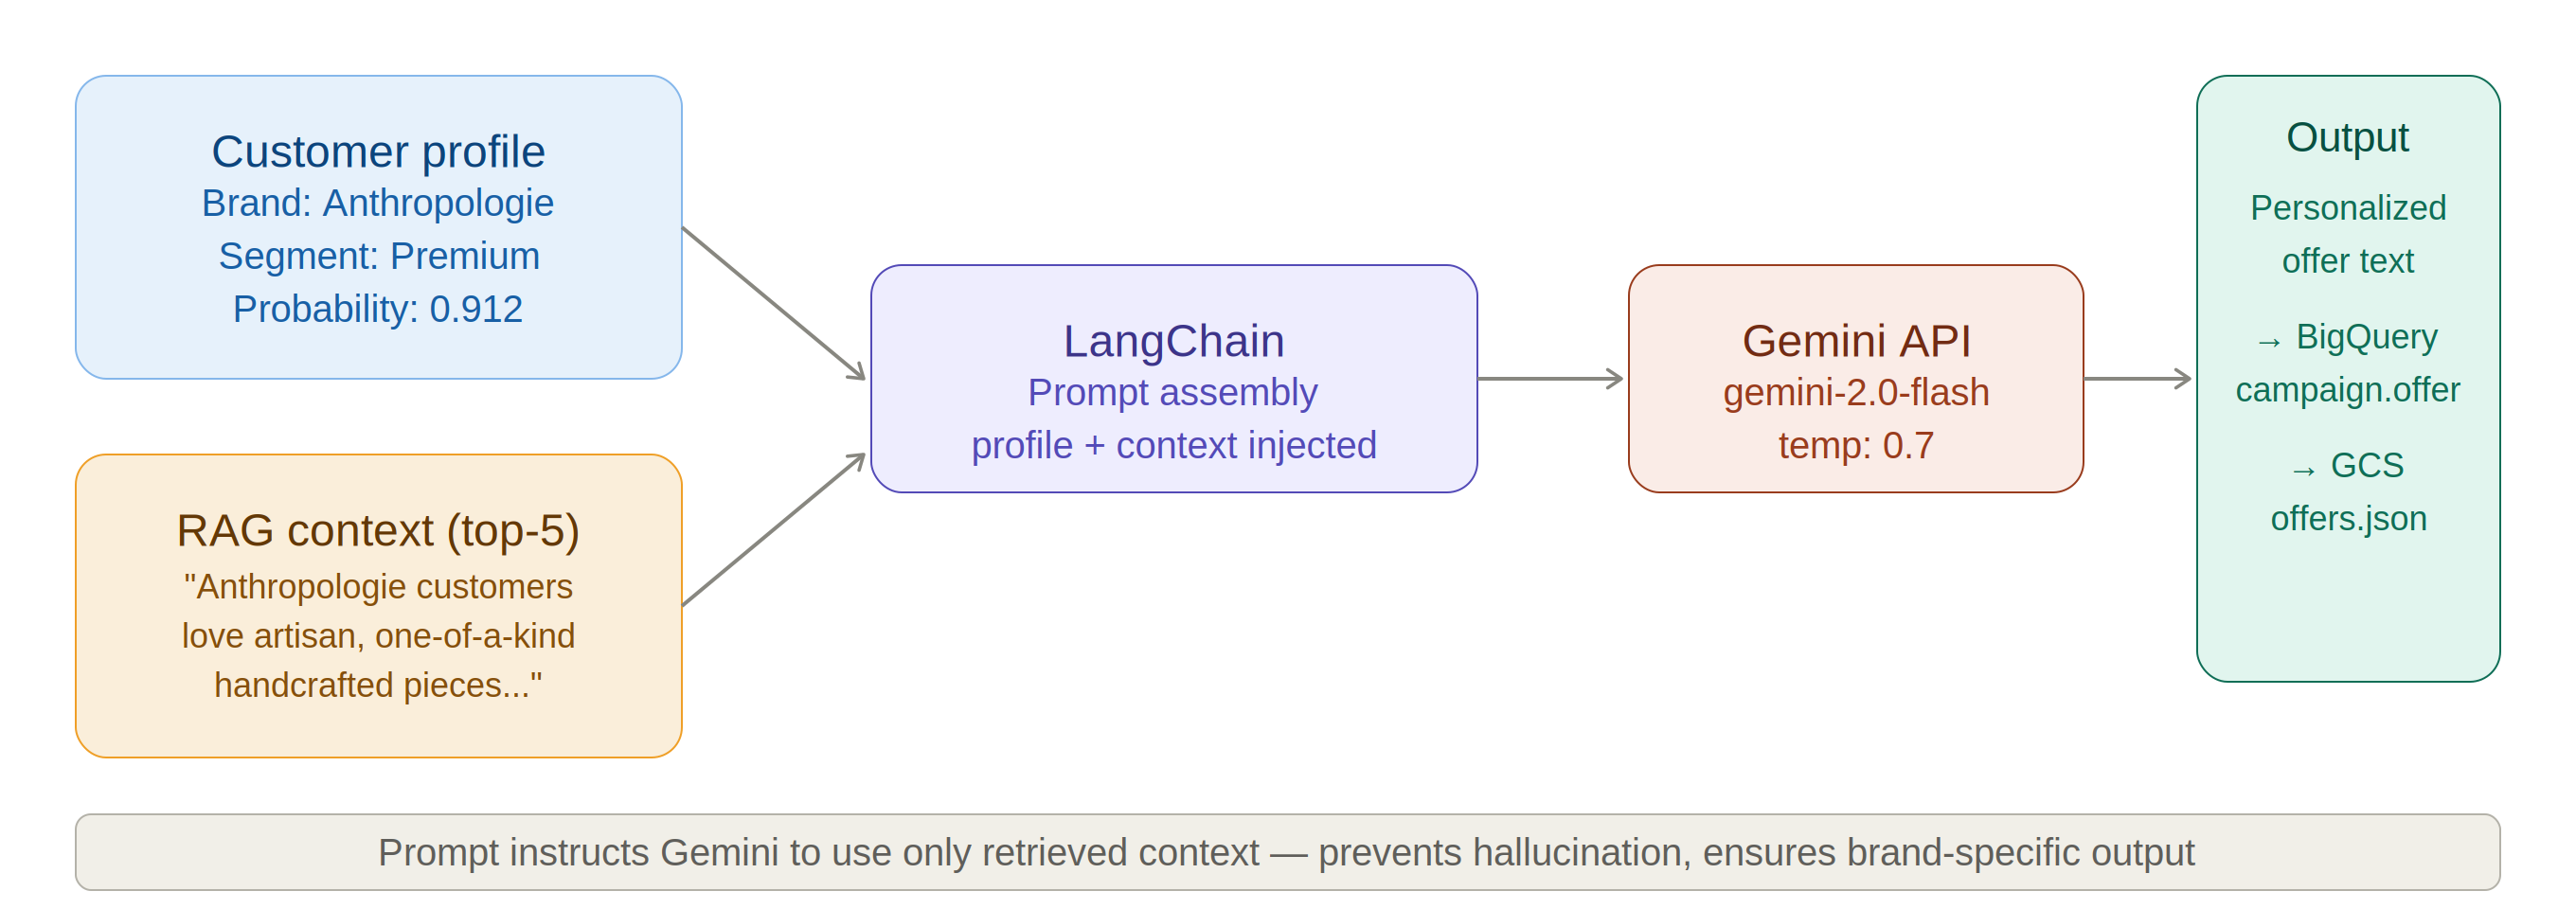
Figure 4.1. Gemini offer generation — customer profile + category top-5 products + RAG context → personalized offer with discount
| Segment | Probability Range | Discount | Count |
|---|---|---|---|
| Premium | 0.85 – 1.00 | 20% | 30 |
| Very High | 0.75 – 0.85 | 15% | 0 |
4.2 Sample Generated Offers
The outputs below are actual offers generated by the pipeline. Each offer includes a product selected from the customer's preferred category and a discount matched to their segment.
"Dear Valued Customer, this Mother's Day, show your appreciation! As a Premium member, enjoy 20% off our chic Miss Chase Teal Top. A perfect, thoughtful gift she'll love. Make her day special with this exclusive offer. Shop now!"
"Celebrate Mom this Mother's Day with a gift as radiant as she is! This exquisite Karatcraft Duilla Ruby Gold Diamond Ring is the perfect expression of your love, and as a Premium member, you enjoy an exclusive 20% discount. Make this Mother's Day unforgettable — shop now!"
"Hi Customer 15! This Mother's Day, treat yourself or a loved one to something special. Enjoy 20% off as a valued Premium member. Shop now and make this Mother's Day truly memorable!"
4.3 Output Storage — BigQuery campaign.offer
Generated offers are stored in campaign.offer in BigQuery with full metadata: customer ID, favorite brand, preferred category, recommended product ID and name, segment, discount rate, purchase probability, offer text, and generation timestamp. This table serves as the primary data source for the Part 4 BI dashboard.
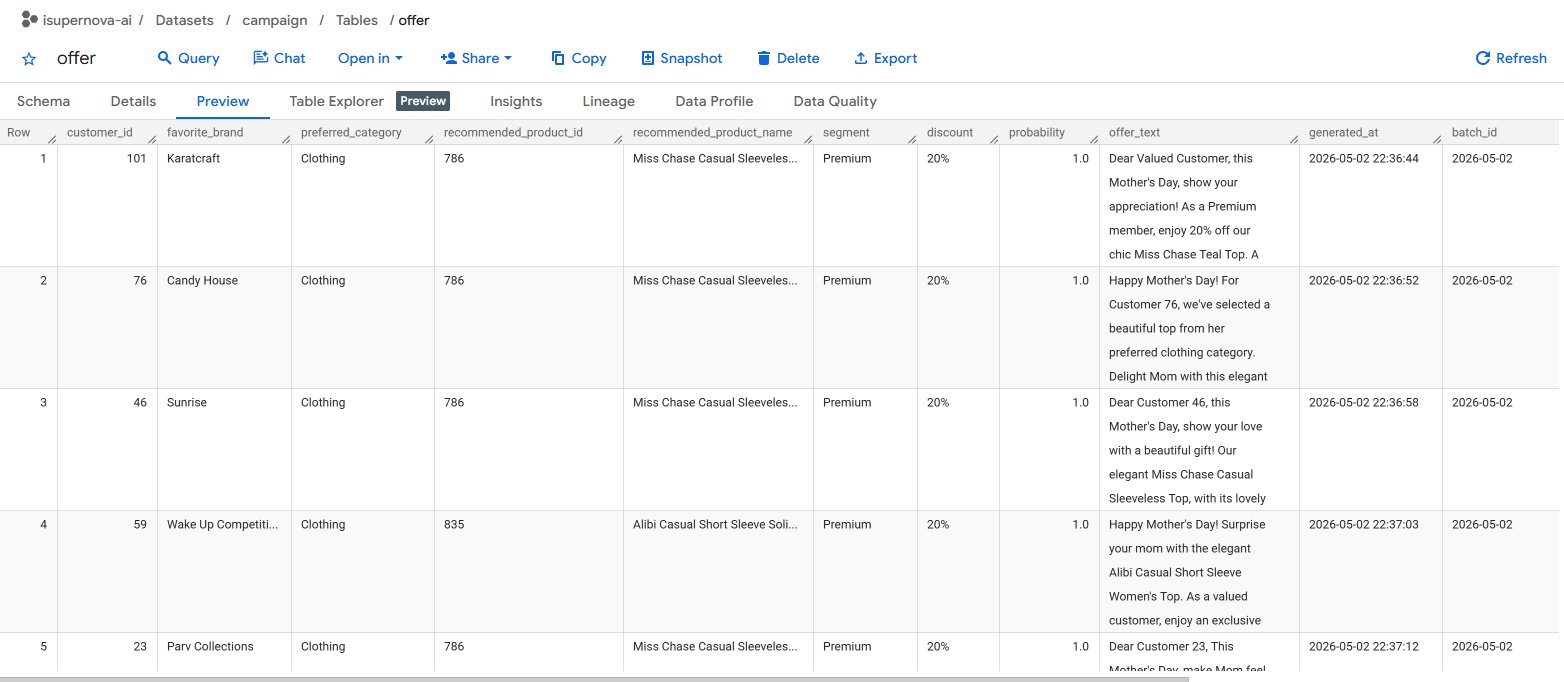
Figure 4.1. BigQuery campaign.offer — 30 personalized offers with product selection and discount metadata
5. Pipeline Orchestration — Current State and Production Path
The Part 2 data pipeline continues to run automatically via Cloud Workflows and Cloud Scheduler, refreshing mart.customer_features every day at 01:00 UTC. The ML prediction and offer generation steps demonstrated in this post are run on demand during campaign periods using Vertex AI Colab Enterprise.
In a production deployment, these steps would be integrated into the automated pipeline as Cloud Run jobs triggered by Cloud Workflows — containerizing the Random Forest scoring script and the LangChain + Gemini offer generation script, then adding them as additional steps in the existing walsh-retail-pipeline workflow. The Part 2 pipeline already provides the orchestration foundation; the intelligence layer steps slot in after the Dataform ETL execution.
Colab Enterprise is the right environment for iterative development — serverless, no infrastructure cost when idle, and native BigQuery connectivity. Once the logic is validated, the same Python code is packaged into a Docker container and deployed as a Cloud Run job for production scheduling. This two-environment pattern (notebook for dev, Cloud Run for prod) is standard in GCP-native ML workflows and keeps development costs near zero.
6. End-to-End Verification
The full intelligence layer was verified end-to-end — tracing the complete flow from refreshed RFM features through ML prediction, RAG retrieval, and Gemini offer generation to the final campaign output in BigQuery.
| Step | Action | Result |
|---|---|---|
| 1. ETL | Dataform executes customer_features.sqlx | mart.customer_features — 200 rows, favorite_brand populated |
| 2. ML Prediction | Random Forest scores all 200 customers | mart.ml_prediction — top 30, prob 0.97–1.0, all Premium |
| 3. Category Mapping | SQL identifies preferred category per customer | 30 customers mapped to preferred category (Clothing, Jewellery, etc.) |
| 4. RAG Retrieval | Pinecone top-3 brand reviews per customer | 90 brand review passages retrieved from walsh-brand-reviews index |
| 5. Offer Generation | Gemini selects product + writes personalized offer | campaign.offer — 30 rows, product selected, discount applied |
6.1 ML Prediction Verification
The first check confirms mart.ml_prediction is populated correctly — 30 customers selected, average probability 0.986, all in the Premium segment.
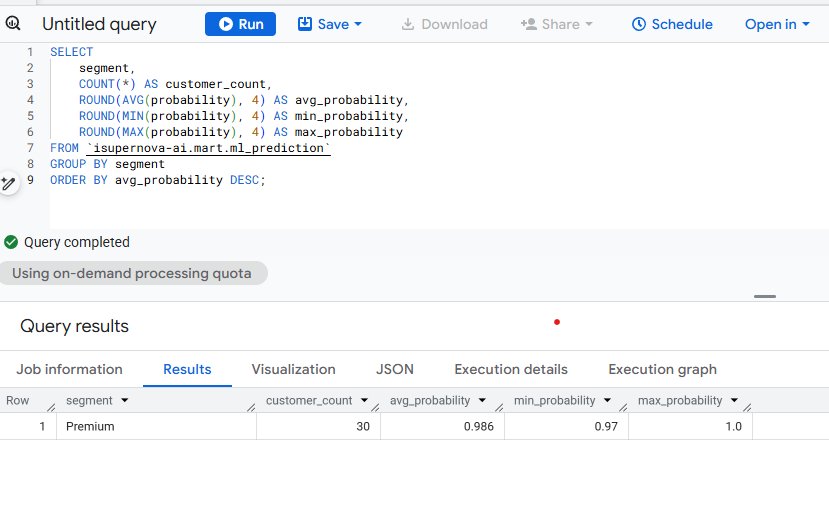
Figure 6.1. BigQuery mart.ml_prediction — 30 Premium customers, avg probability 0.986, min 0.97 / max 1.0
6.2 Campaign Offer Verification
The second check confirms every selected customer received a personalized offer with a product recommendation and correct discount rate applied. Row 7 shows customer 142 (Raymond brand, Jewellery category) received a Karatcraft jewellery product recommendation — confirming that the category-based product selection is working correctly across different preferred categories.
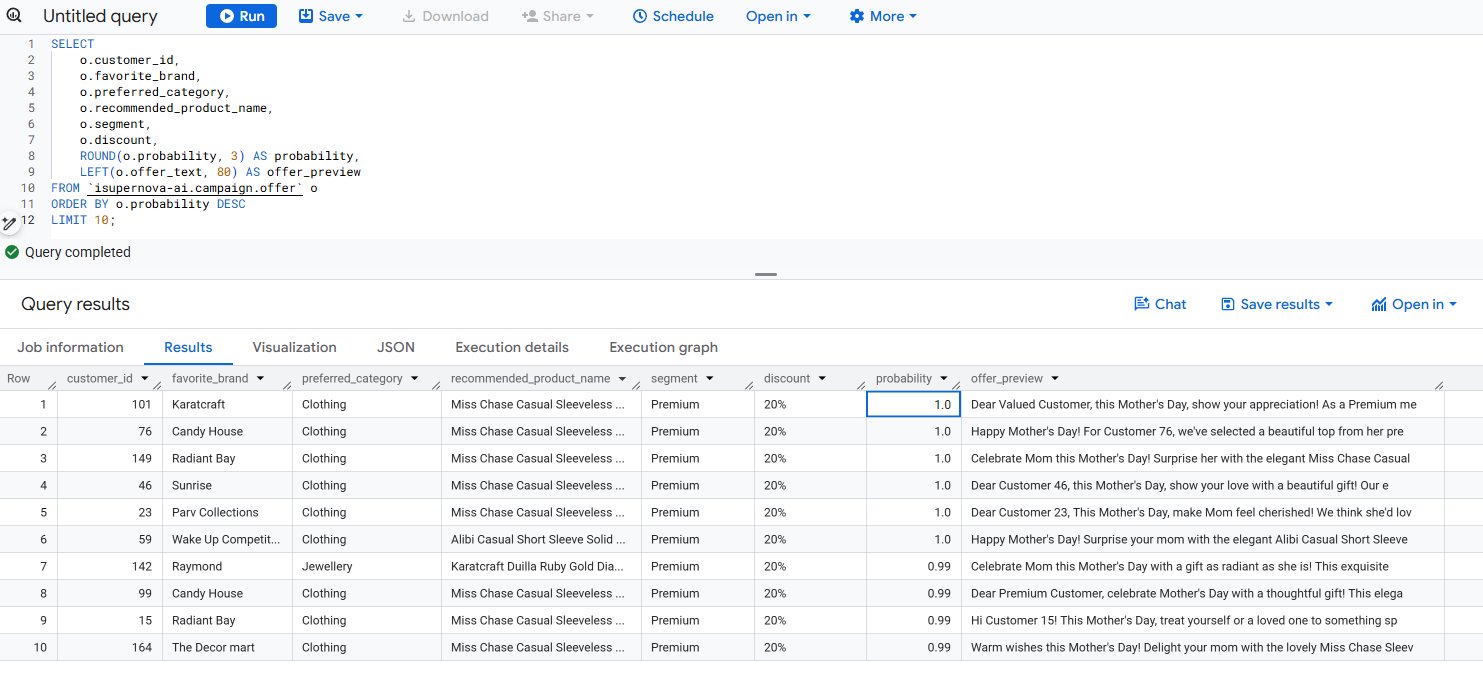
Figure 6.2. BigQuery campaign.offer — top 10 customers with product selection, discount, and offer preview confirmed
Count — did all 30 customers receive an offer? Quality — does the offer include a specific product and correct discount, not generic filler? Category match — does the recommended product match the customer's preferred category? A pipeline that completes without errors but produces generic or mismatched output is a silent failure that is far harder to catch than a pipeline that throws an exception.
7. Complete Intelligence Layer Diagram
The complete Part 3 intelligence layer — from Vertex AI ML prediction through LangChain + Pinecone RAG retrieval to Gemini offer generation — integrated with the Part 2 data pipeline:
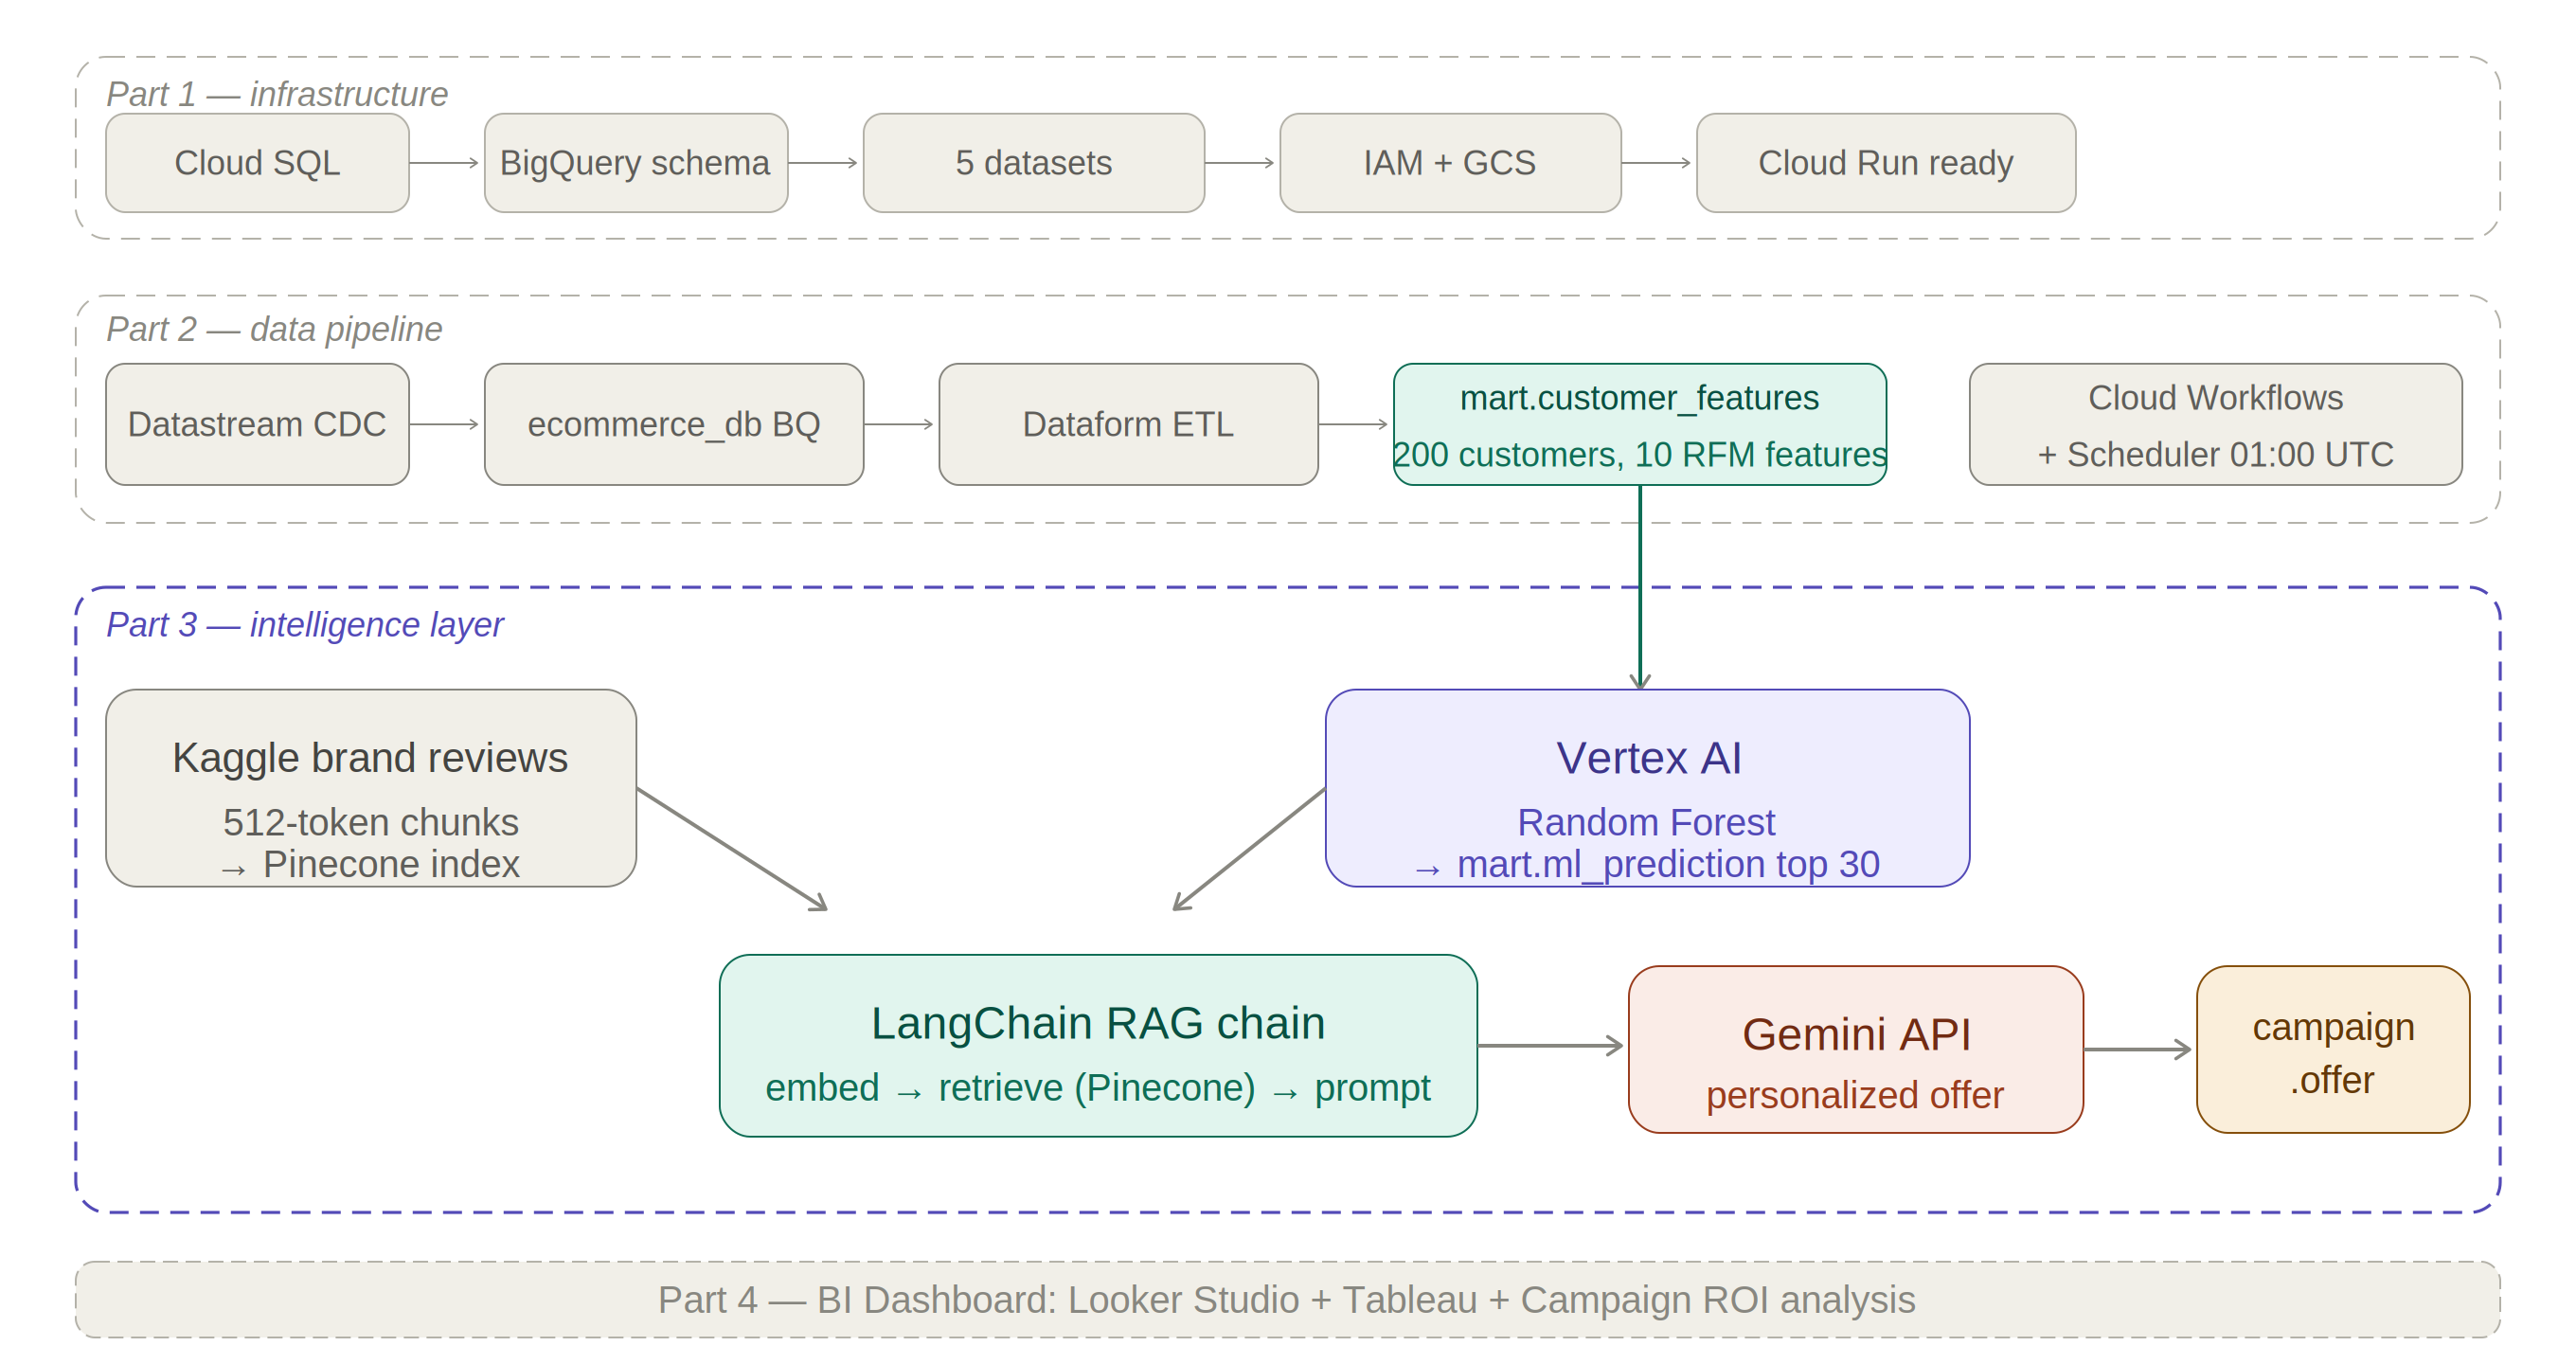
Figure 7.1. Walsh Retail Parts 1–3 — complete architecture from Cloud SQL to personalized campaign offers
With the Intelligence Layer complete — Explainable AI via Random Forest on Vertex AI, brand knowledge retrieval via LangChain and Pinecone, and personalized product-matched offer generation via Gemini API — the Walsh Retail AI Agent now produces 30 individualized campaign messages automatically, each with a specific product recommendation and segment-based discount. Every prediction is interpretable, every offer is grounded in real product and brand data.
In the final post, we build the BI Dashboard — connecting campaign results to Tableau Public, presenting the full campaign KPIs and offer table for executive review. Stay tuned for Part 4.
Coming up in Part 4: BI Dashboard & Campaign Results
Tableau Public dashboard, campaign KPI summary, offer results table, and the full ROI story of the Walsh Retail autonomous marketing agent.
The sample data and source code for this project are available upon request. Feel free to reach out via the contact page.