Intro.
At the AI Action Summit in Paris in February 2025, Yann LeCun said: "Within three to five years, no one in their right mind would use LLMs of the type we have today. World models will be the dominant AI architecture." That December, he left Meta to found AMI Labs. Google DeepMind launched Genie 3. NVIDIA released the Cosmos platform. By 2026, world models had become the hottest topic in AI research.
Yet all of this work targets robots, autonomous vehicles, and video generation. The questions businesses face every day — "How much inventory should I stock before a disaster hits?" — have received almost no attention from the world model community. This note documents the first experiment to fill that gap.
0. What Is a World Model?
0.1 A Definition Still Evolving
There is no single, standardized definition of a world model. Researchers and companies use the term with slightly different nuances depending on their goals. The concept is actively evolving across three distinct perspectives.
| Perspective | Key Researchers | Definition | Core Question |
|---|---|---|---|
| Understanding | Ha & Schmidhuber (2018) | A model that abstracts the external world to understand its underlying mechanisms | "How does the world work?" |
| Prediction | LeCun (2022–) | A model that not only perceives the world but predicts future states to inform action | "What happens if I act?" |
| Generation | OpenAI Sora, Google Genie | A model that learns physical laws and generates future scenarios as video | "What comes next?" |
Common thread: All three go beyond pattern recognition — finding patterns in past data — toward learning the laws by which the world operates, enabling simulation of outcomes before action is taken.
0.2 Where Is It Being Applied?
| Domain | Key Examples | Maturity |
|---|---|---|
| Physical AI | Autonomous driving (Waymo), robotics, NVIDIA Cosmos, manufacturing automation | ✅ Established — physical laws are explicit and simulators are mature |
| Social AI | Election prediction (SocioVerse), pandemic simulation, macroeconomic ABM (EconAgent) | 🔄 Active research — LLM-powered large-scale social simulation underway |
| Business AI | Demand forecasting, inventory optimization, marketing strategy | ⬜ Gap — AI prediction exists, but world model framework does not |
0.3 Goldman Sachs: Extending the Concept to Social Systems
"A physical world model can simulate how a hurricane season reshapes insured-loss distributions. A social world model can forecast how a policy shock cascades through markets and behavior. Physical laws constrain motion. Social rules constrain behavior. Objects exert forces. Incentives do the same."
This framing is the starting point for this research. A disaster is a shock applied to the social world. Panic-buying is the market's law-governed response to that shock. Just as physical laws can be learned and simulated, consumer behavior laws can be too.
1. The Gap in Business AI: Prediction vs. Simulation
1.1 The Current State
By 2026, AI-driven demand forecasting has reached a meaningful level of maturity. Amazon adjusts prices in real time. Siemens auto-updates production plans. Unilever has automated demand planning. McKinsey research shows AI-based forecasting reduces errors by 20–50% and stockouts by up to 65%.
But all of this is still pattern recognition.
| Current Business AI (Pattern Recognition) | World Model (Law Understanding) |
|---|---|
| "Sales were high last January, so they will be high this January." | "When GDELT news volume exceeds X articles, consumers buy Y% more within 48 hours." |
| Past data → future prediction (one-directional) | Observe → learn laws → simulate scenarios → decide (cyclical) |
| Brittle to novel event types (pandemic, disaster, black swan) | New scenarios can be simulated before they occur |
| React after the event | Act before the event |
1.2 Proposed Definition: Business World Model
A Business World Model is an AI system that learns the laws governing consumer behavior, market response, and external shocks (disasters, events, policy changes) on demand — and enables organizations to simulate a wide range of scenarios before taking action, supporting optimal inventory, marketing, and supply chain decisions.
The key distinction: LLMs predict text. Physical world models predict object motion. A business world model predicts consumer behavior.
2. How It Works: The Infinite Learning Cycle
A business world model operates as a three-step cycle that repeats indefinitely.
| Step 1: Observe the Real World | Step 2: Learn the Laws | Step 3: Simulate Virtually |
|---|---|---|
| Collect actual sales data Collect external signals (news, weather) Observe consumer behavior before/after disasters |
Train TFT model "Which signals drive demand changes?" Extract key laws via SHAP |
Monte Carlo simulation "What happens if news volume 5x?" Calculate inventory planning ranges |
| This study: M5 Walmart + Rossmann + GDELT + Weather | This study: TFT + SHAP Feature Importance | This study: Monte Carlo What-if (1,000 runs) |
When the three steps are complete, simulation outcomes feed back into Step 1 as new observation data. The model becomes more accurate. The simulation becomes more realistic. This is the infinite learning cycle that defines a world model.
This research implements Steps 1 through 3 — the first complete loop of the cycle. The next phase (Capstone) will add an RL Agent on top of TFT + Monte Carlo, enabling the system to make actual decisions based on simulation results and retrain from real outcomes — completing the full infinite cycle.
3. Case Study: Disasters × Consumer Behavior
3.1 Study Design
Disaster events were selected as the first application domain for two reasons. First, disasters represent a clear, unambiguous external shock to the consumer world. Second, the response — panic-buying — is repetitive and shows consistent patterns across geographies and time periods.
| US Case | Germany Case | |
|---|---|---|
| Disaster type | Extreme Cold (Polar Vortex) | Major Flood (Elbe River) |
| Event | WI Polar Vortex 2014 (Jan 6–8, −40°F) | Elbe Flood 2013 (Jun 1–15, EUR 8.7B damage) |
| Data | M5 Walmart + GDELT | Rossmann + GDELT + Weather |
| Model | TFT + SHAP + Monte Carlo | TFT + SHAP + Monte Carlo |
3.2 EDA: Discovering Consumer Behavior Laws
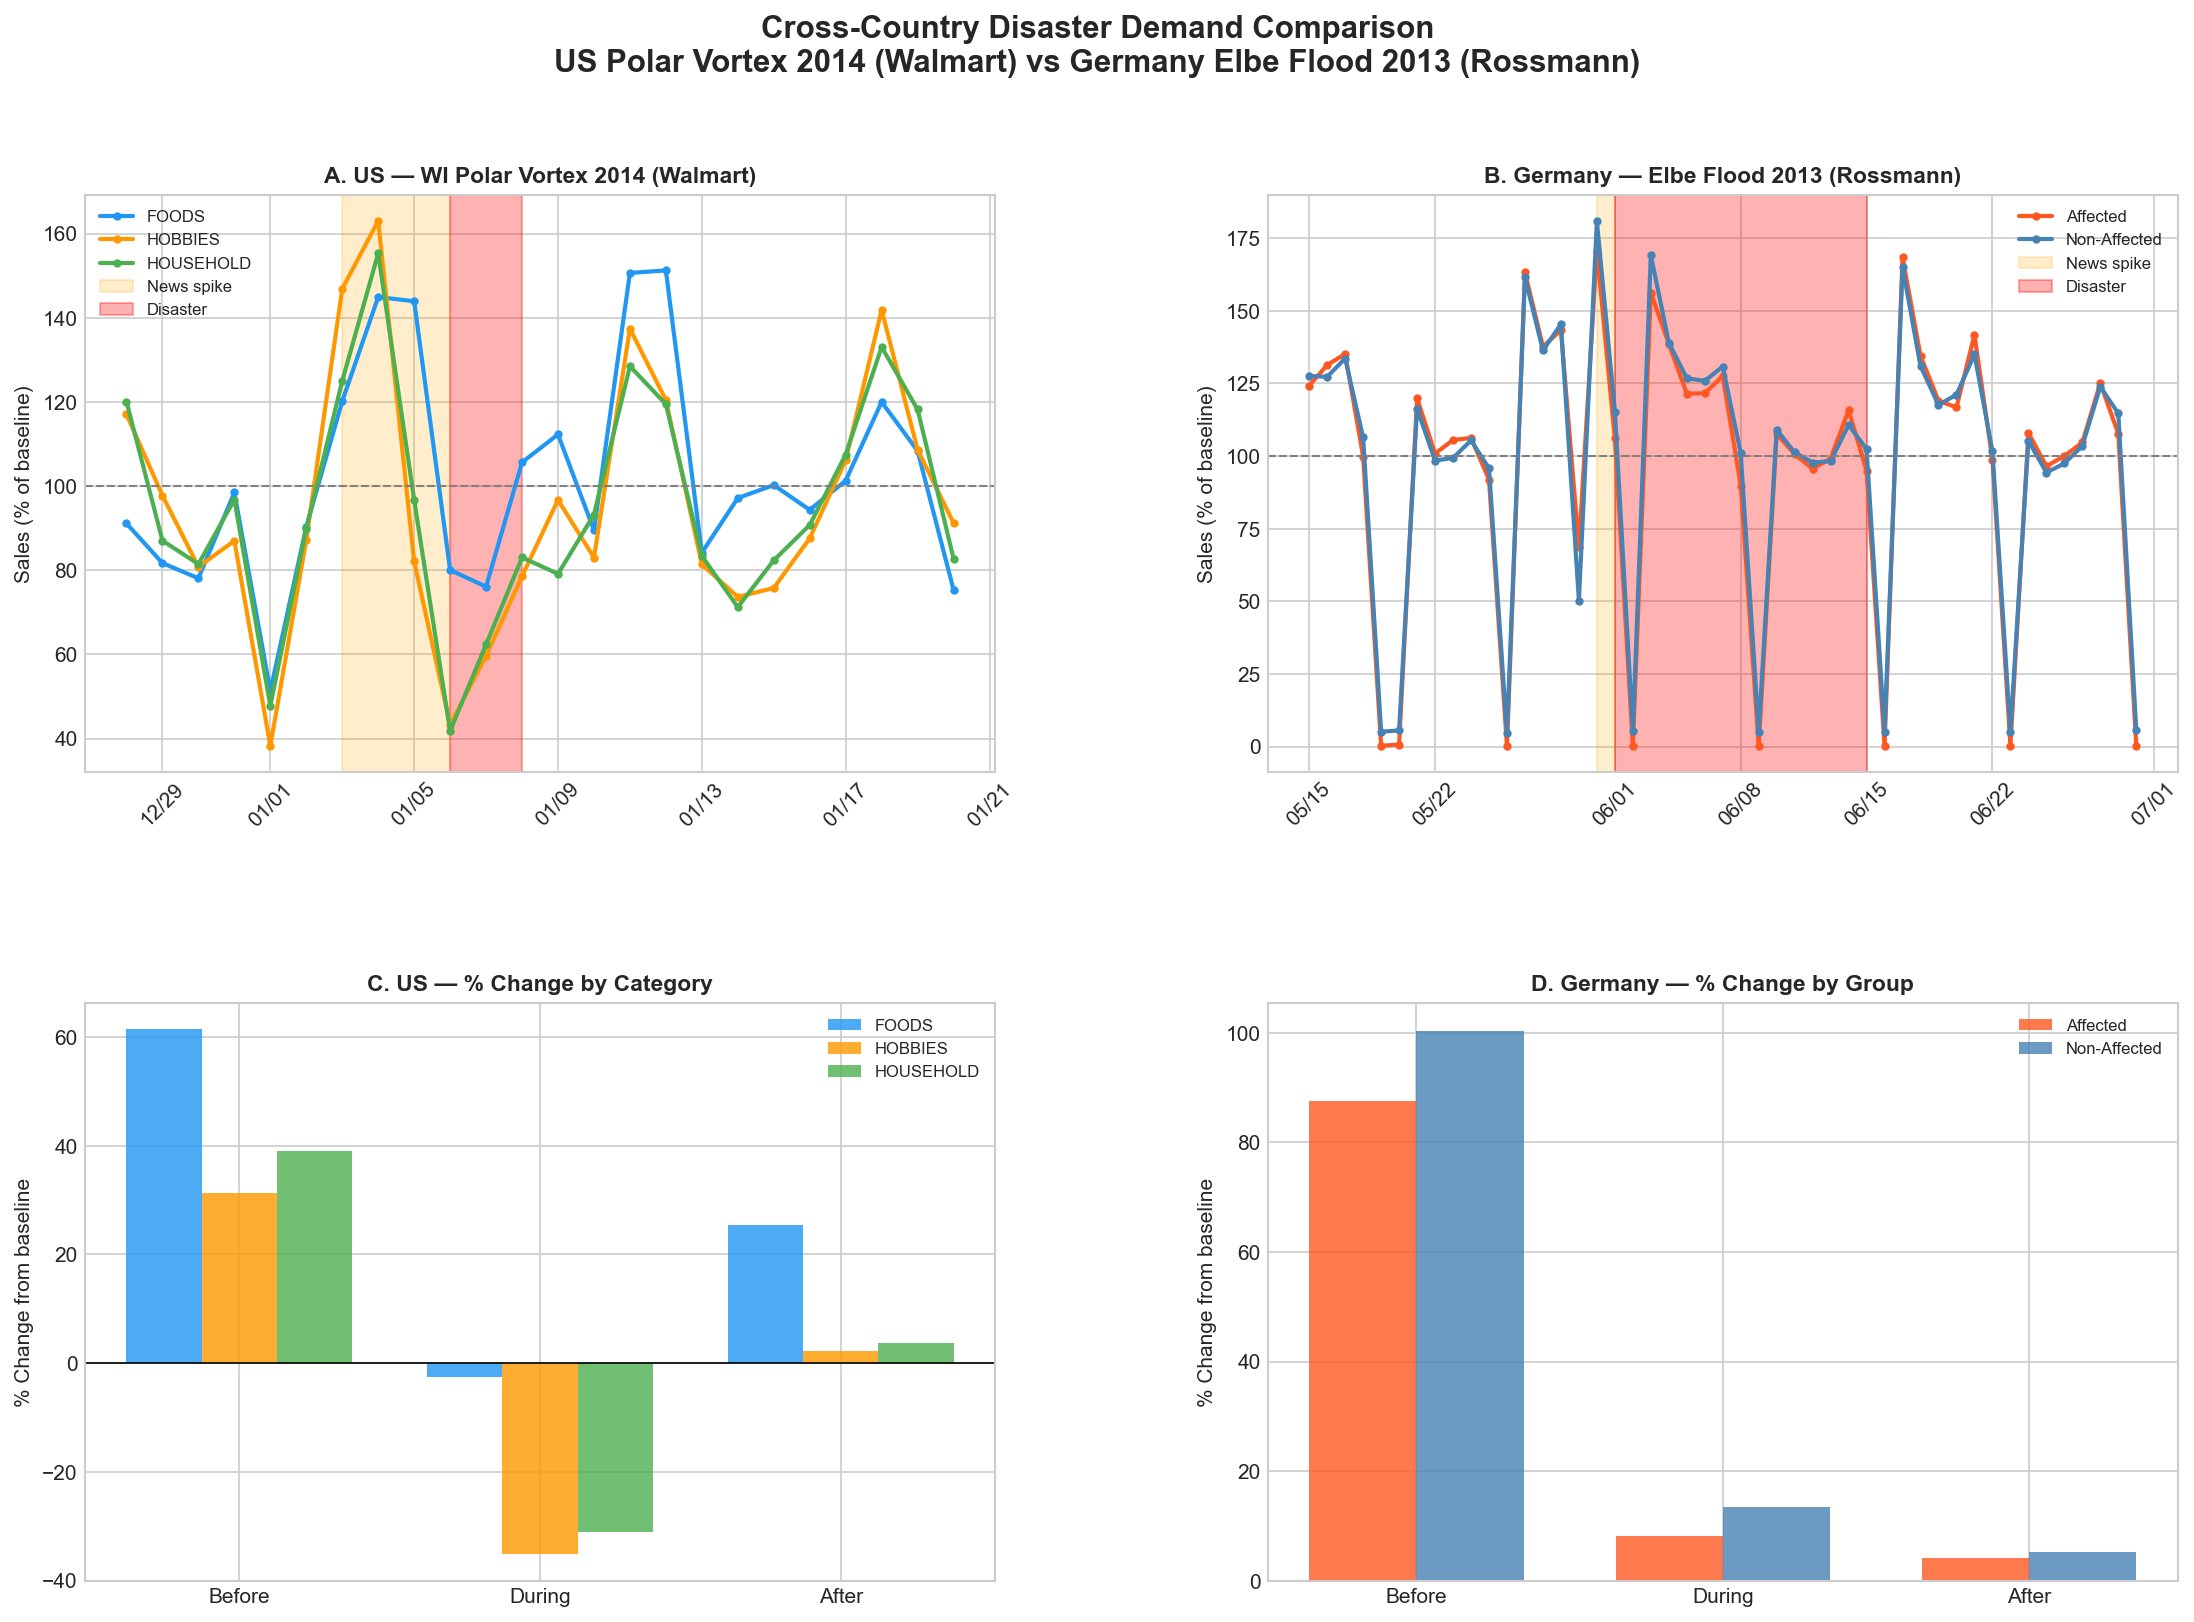
Figure 1. US (WI Polar Vortex) vs Germany (Elbe Flood) sales comparison. Panic-buying confirmed in both countries before the disaster. Orange shading = news spike window; red shading = disaster period.
EDA confirmed panic-buying patterns in both countries. But the mechanics of the behavior showed important differences.
| Period | US — Extreme Cold (WI) | Germany — Flood (Elbe) |
|---|---|---|
| Before (panic-buying) | FOODS +61.4%, HOUSEHOLD +39.1% | All stores +87.5% (affected states), +100.4% (non-affected states too) |
| During (disaster) | HOBBIES −67.3%, HOUSEHOLD −53.5% (full lockdown — cannot leave home) |
+8.1% (flood does not prevent mobility) |
| Geographic spread | Localized to WI only | Nationwide — non-affected states reacted equally |
3.3 GDELT: Leading Indicator Analysis
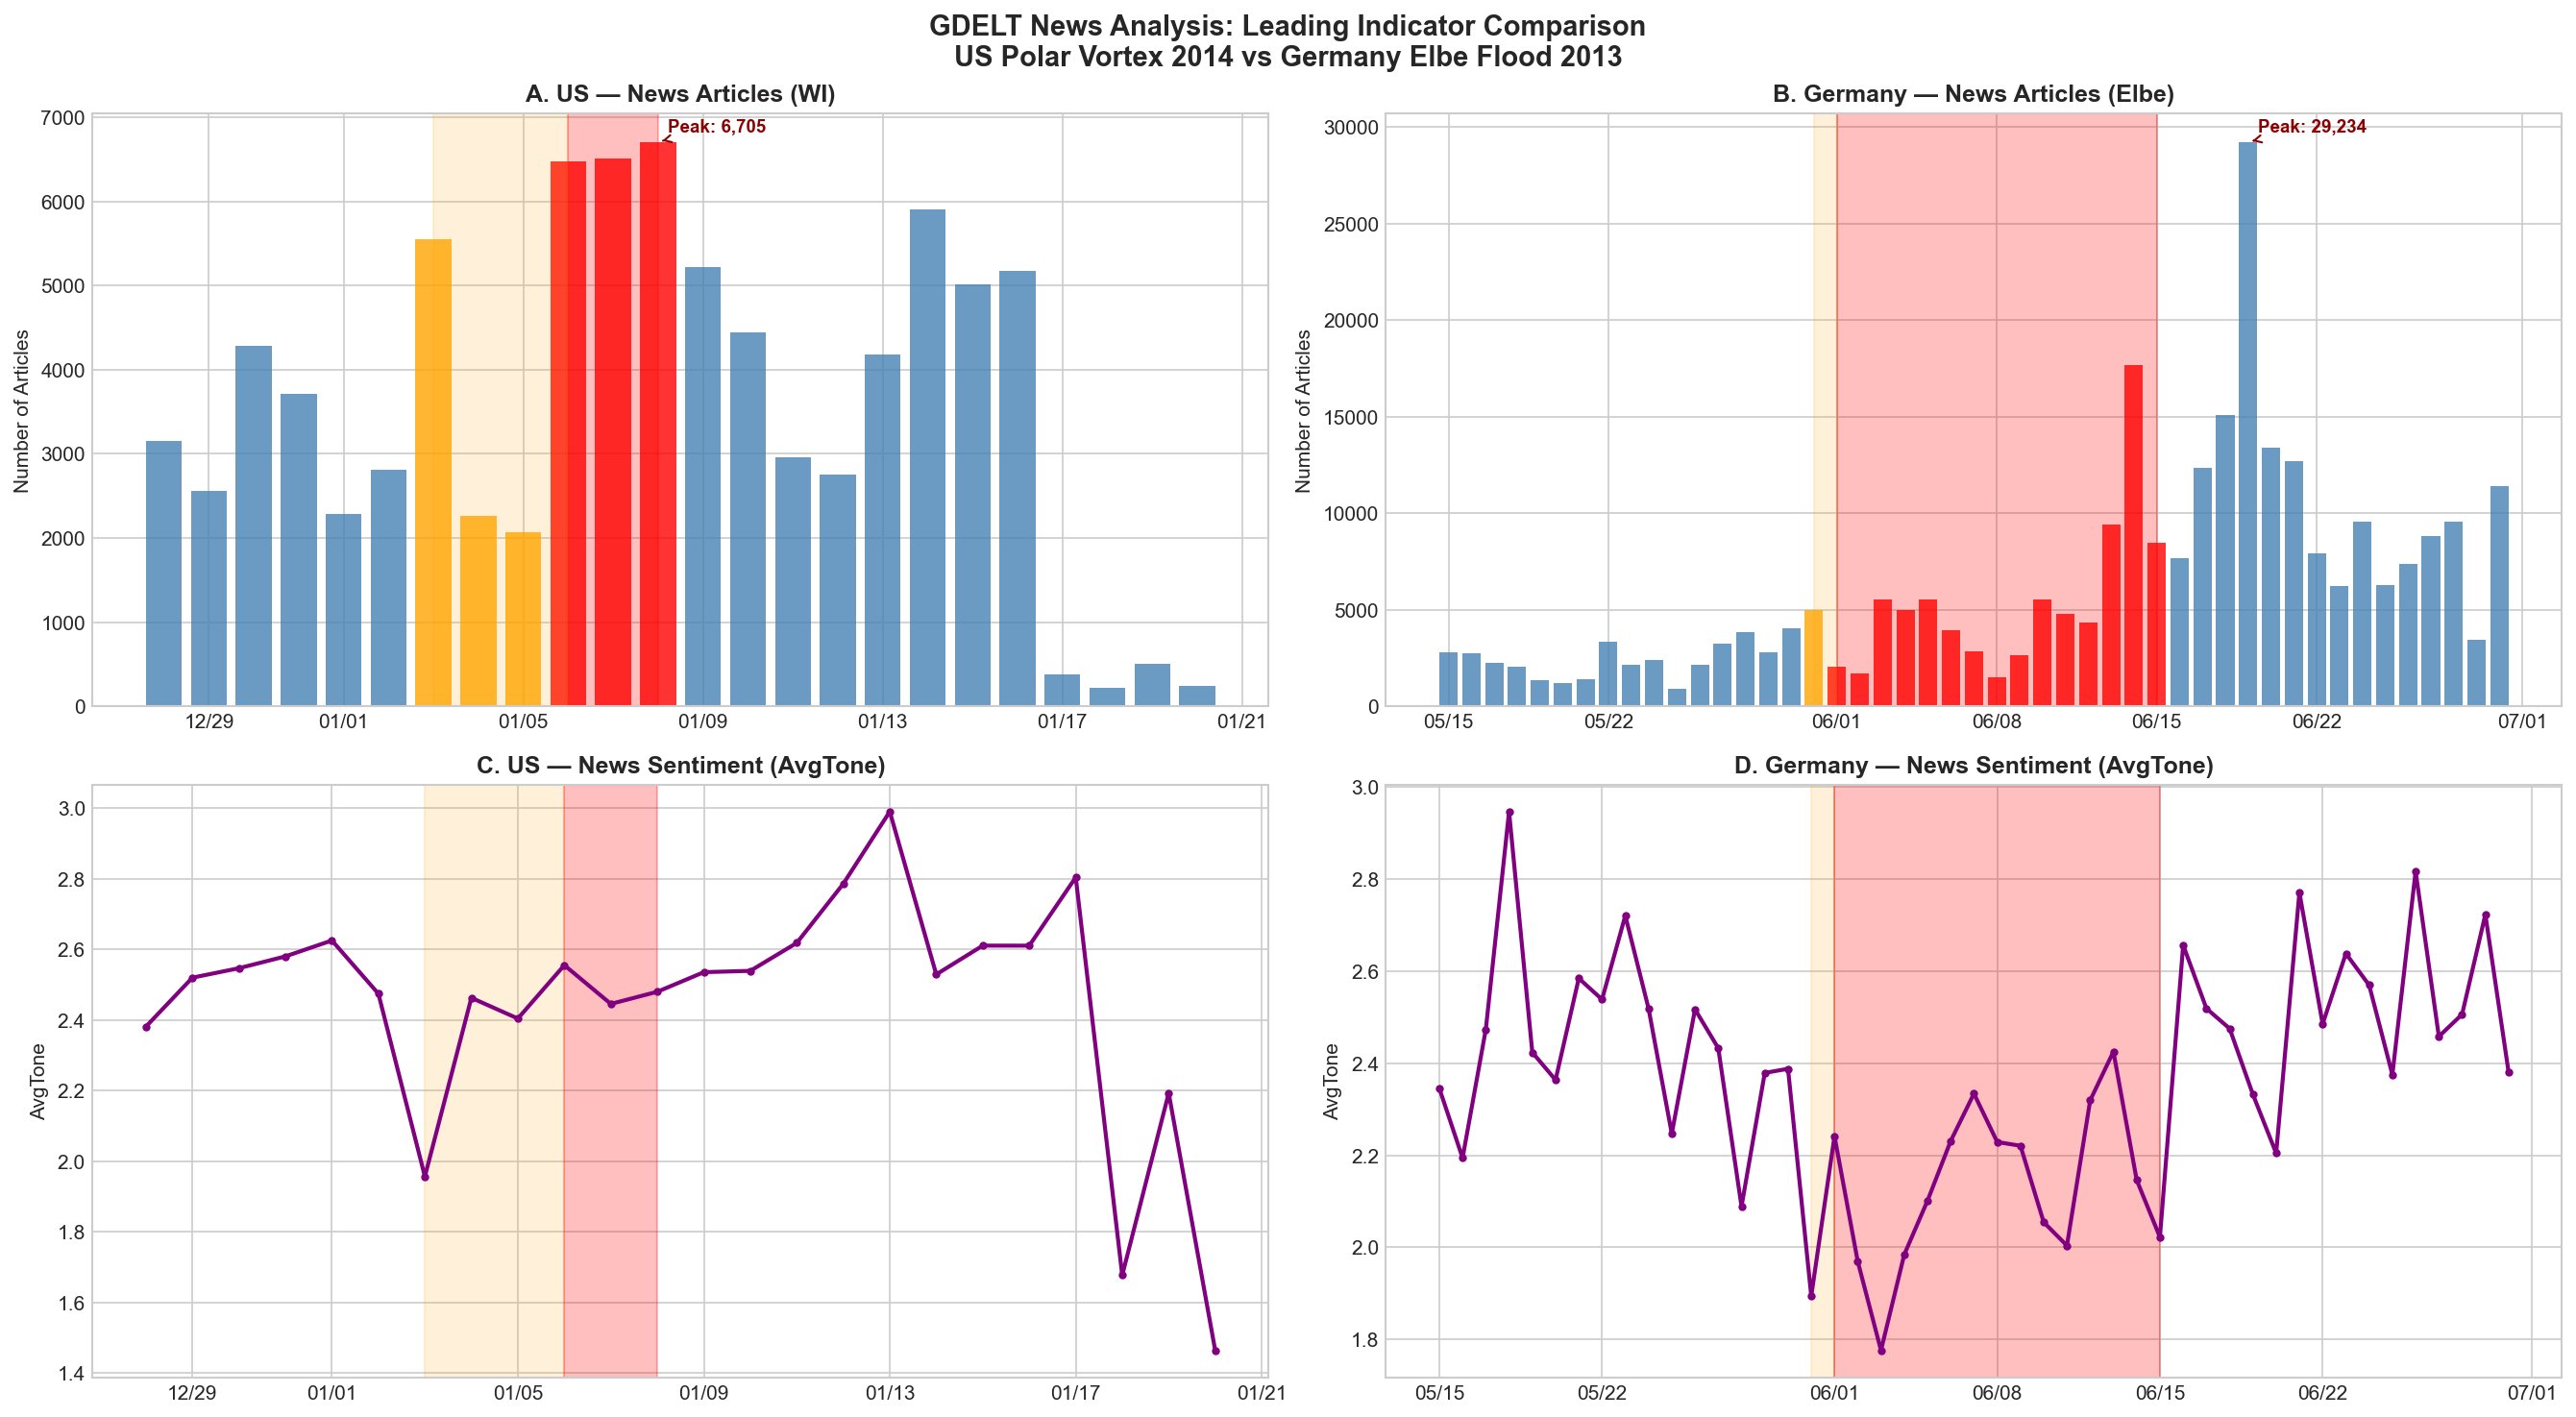
Figure 2. GDELT news volume comparison. US (left): news spikes before disaster → leading indicator confirmed. Germany (right): news peaks after disaster → lagging indicator.
Key finding: The leading indicator differs by disaster type.
- US Polar Vortex: GDELT articles spike to 5,550 on January 3 → sales surge +61% same day → disaster arrives January 6. News leads by 3 days.
- Germany Elbe Flood: Sales surge +175% on June 1 → GDELT peaks at 29,234 articles on June 15. Water comes first. News follows.
This reveals two different consumer behavior laws. For extreme cold, consumers respond to forecasts (news). For floods, consumers respond to physical reality (rising water). The trigger is fundamentally different.
3.4 TFT Feature Importance: What the ML Model Learned
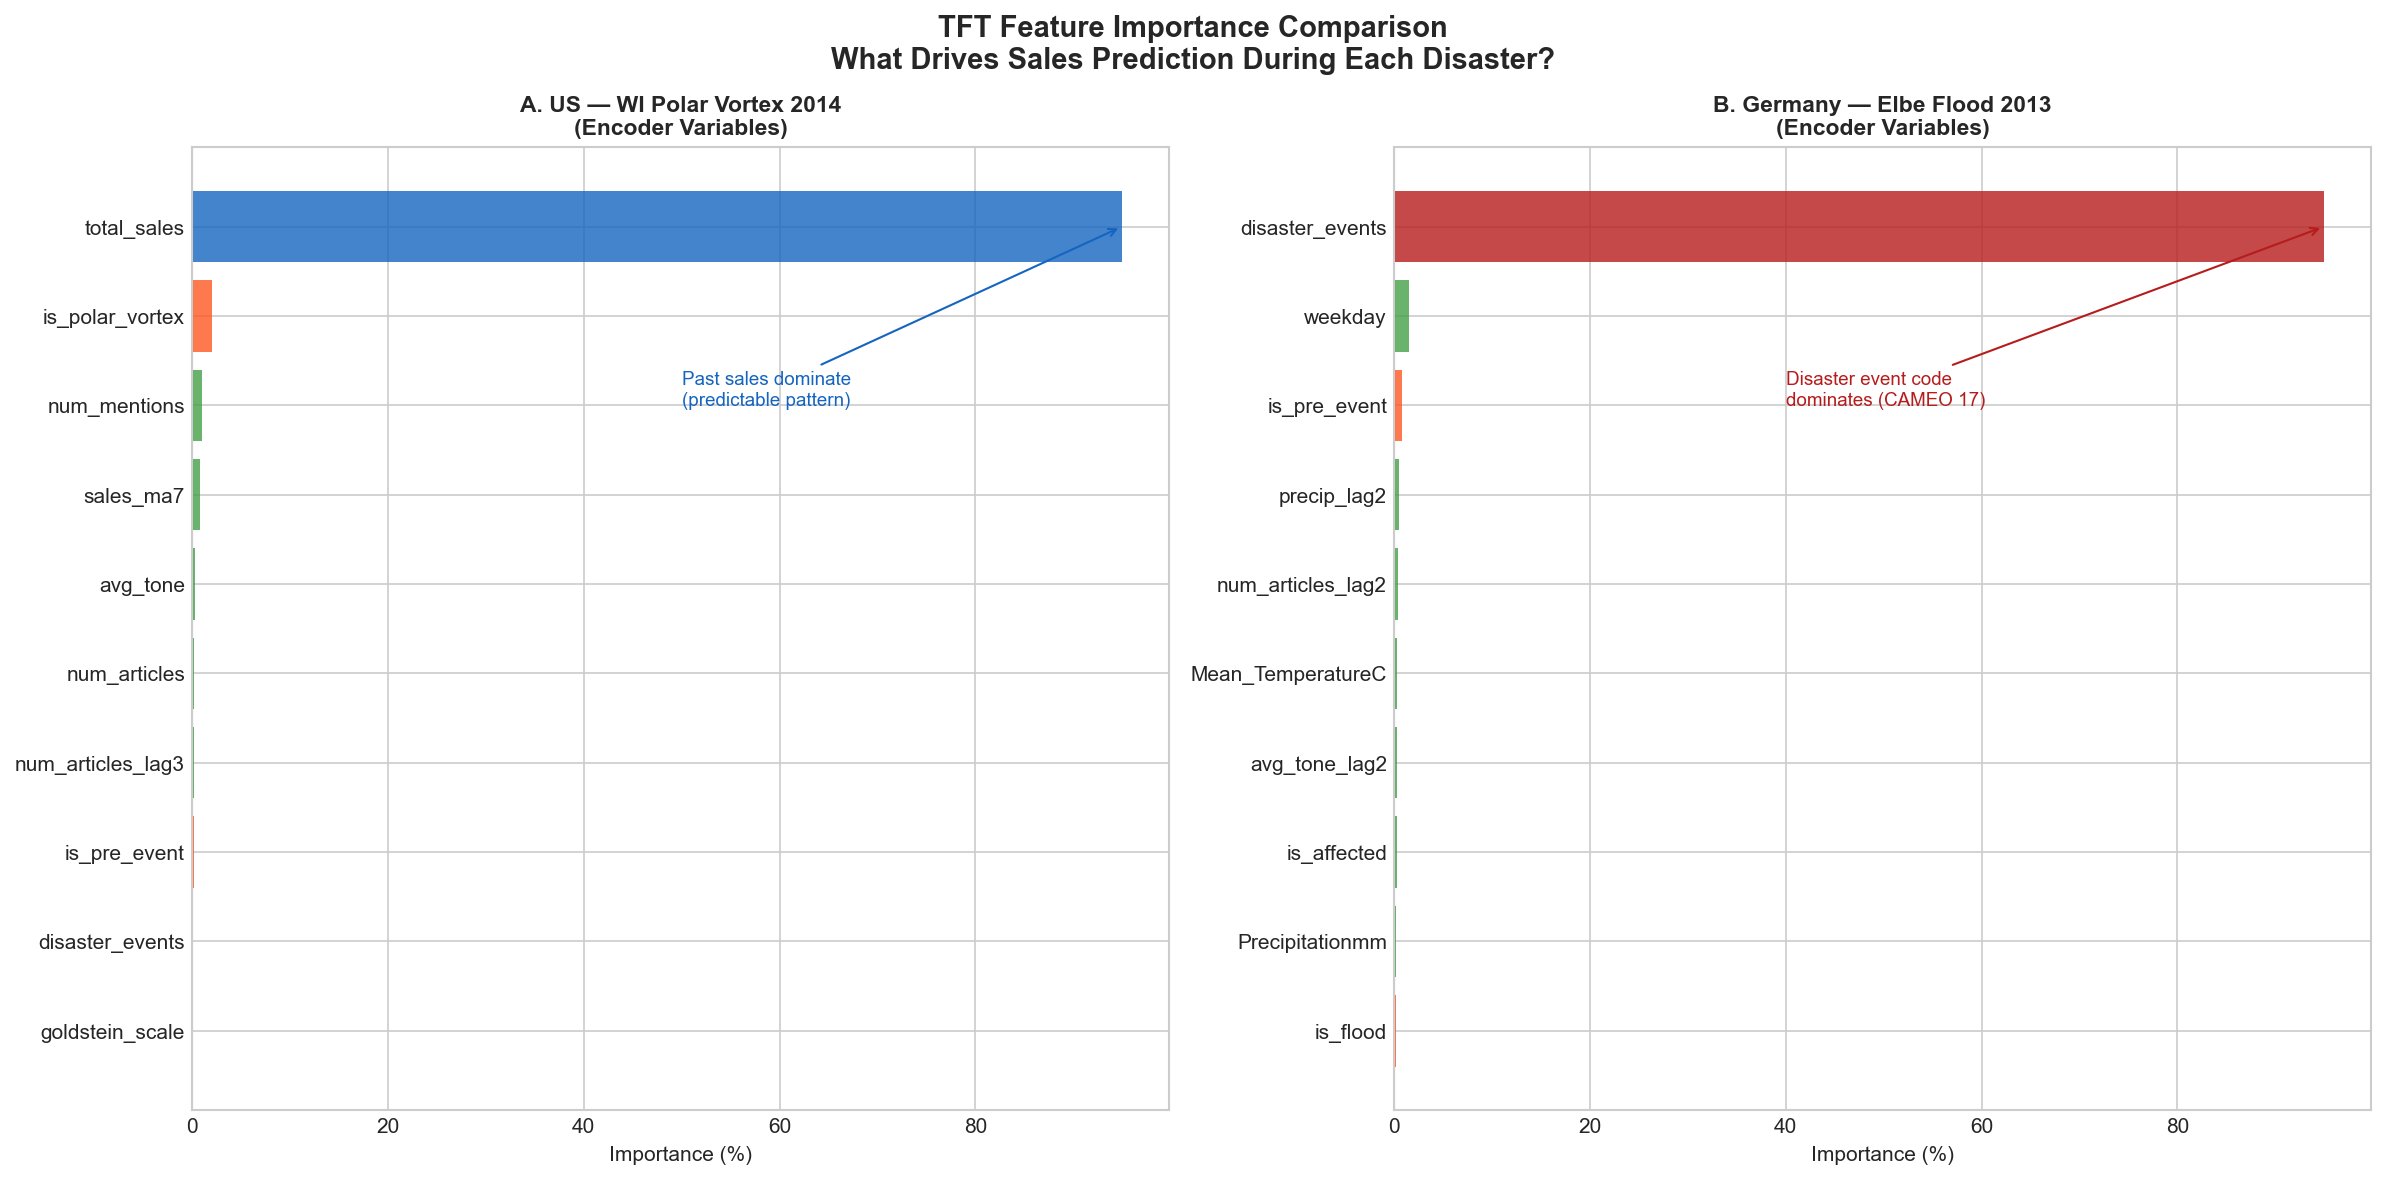
Figure 3. TFT encoder variable importance. US: past sales pattern dominates (95%). Germany: GDELT disaster event code CAMEO 17 dominates (95%).
The TFT results provided machine learning validation of the EDA findings.
- US (total_sales 95%): Extreme cold is seasonal and predictable. Past sales patterns alone are sufficient for accurate forecasting.
- Germany (disaster_events 95%): For floods, the GDELT disaster event classification code (CAMEO code 17) is the strongest predictor — stronger than news volume, stronger than precipitation. The fact that a disaster has been classified is the signal itself.
3.5 Monte Carlo: Simulation Results
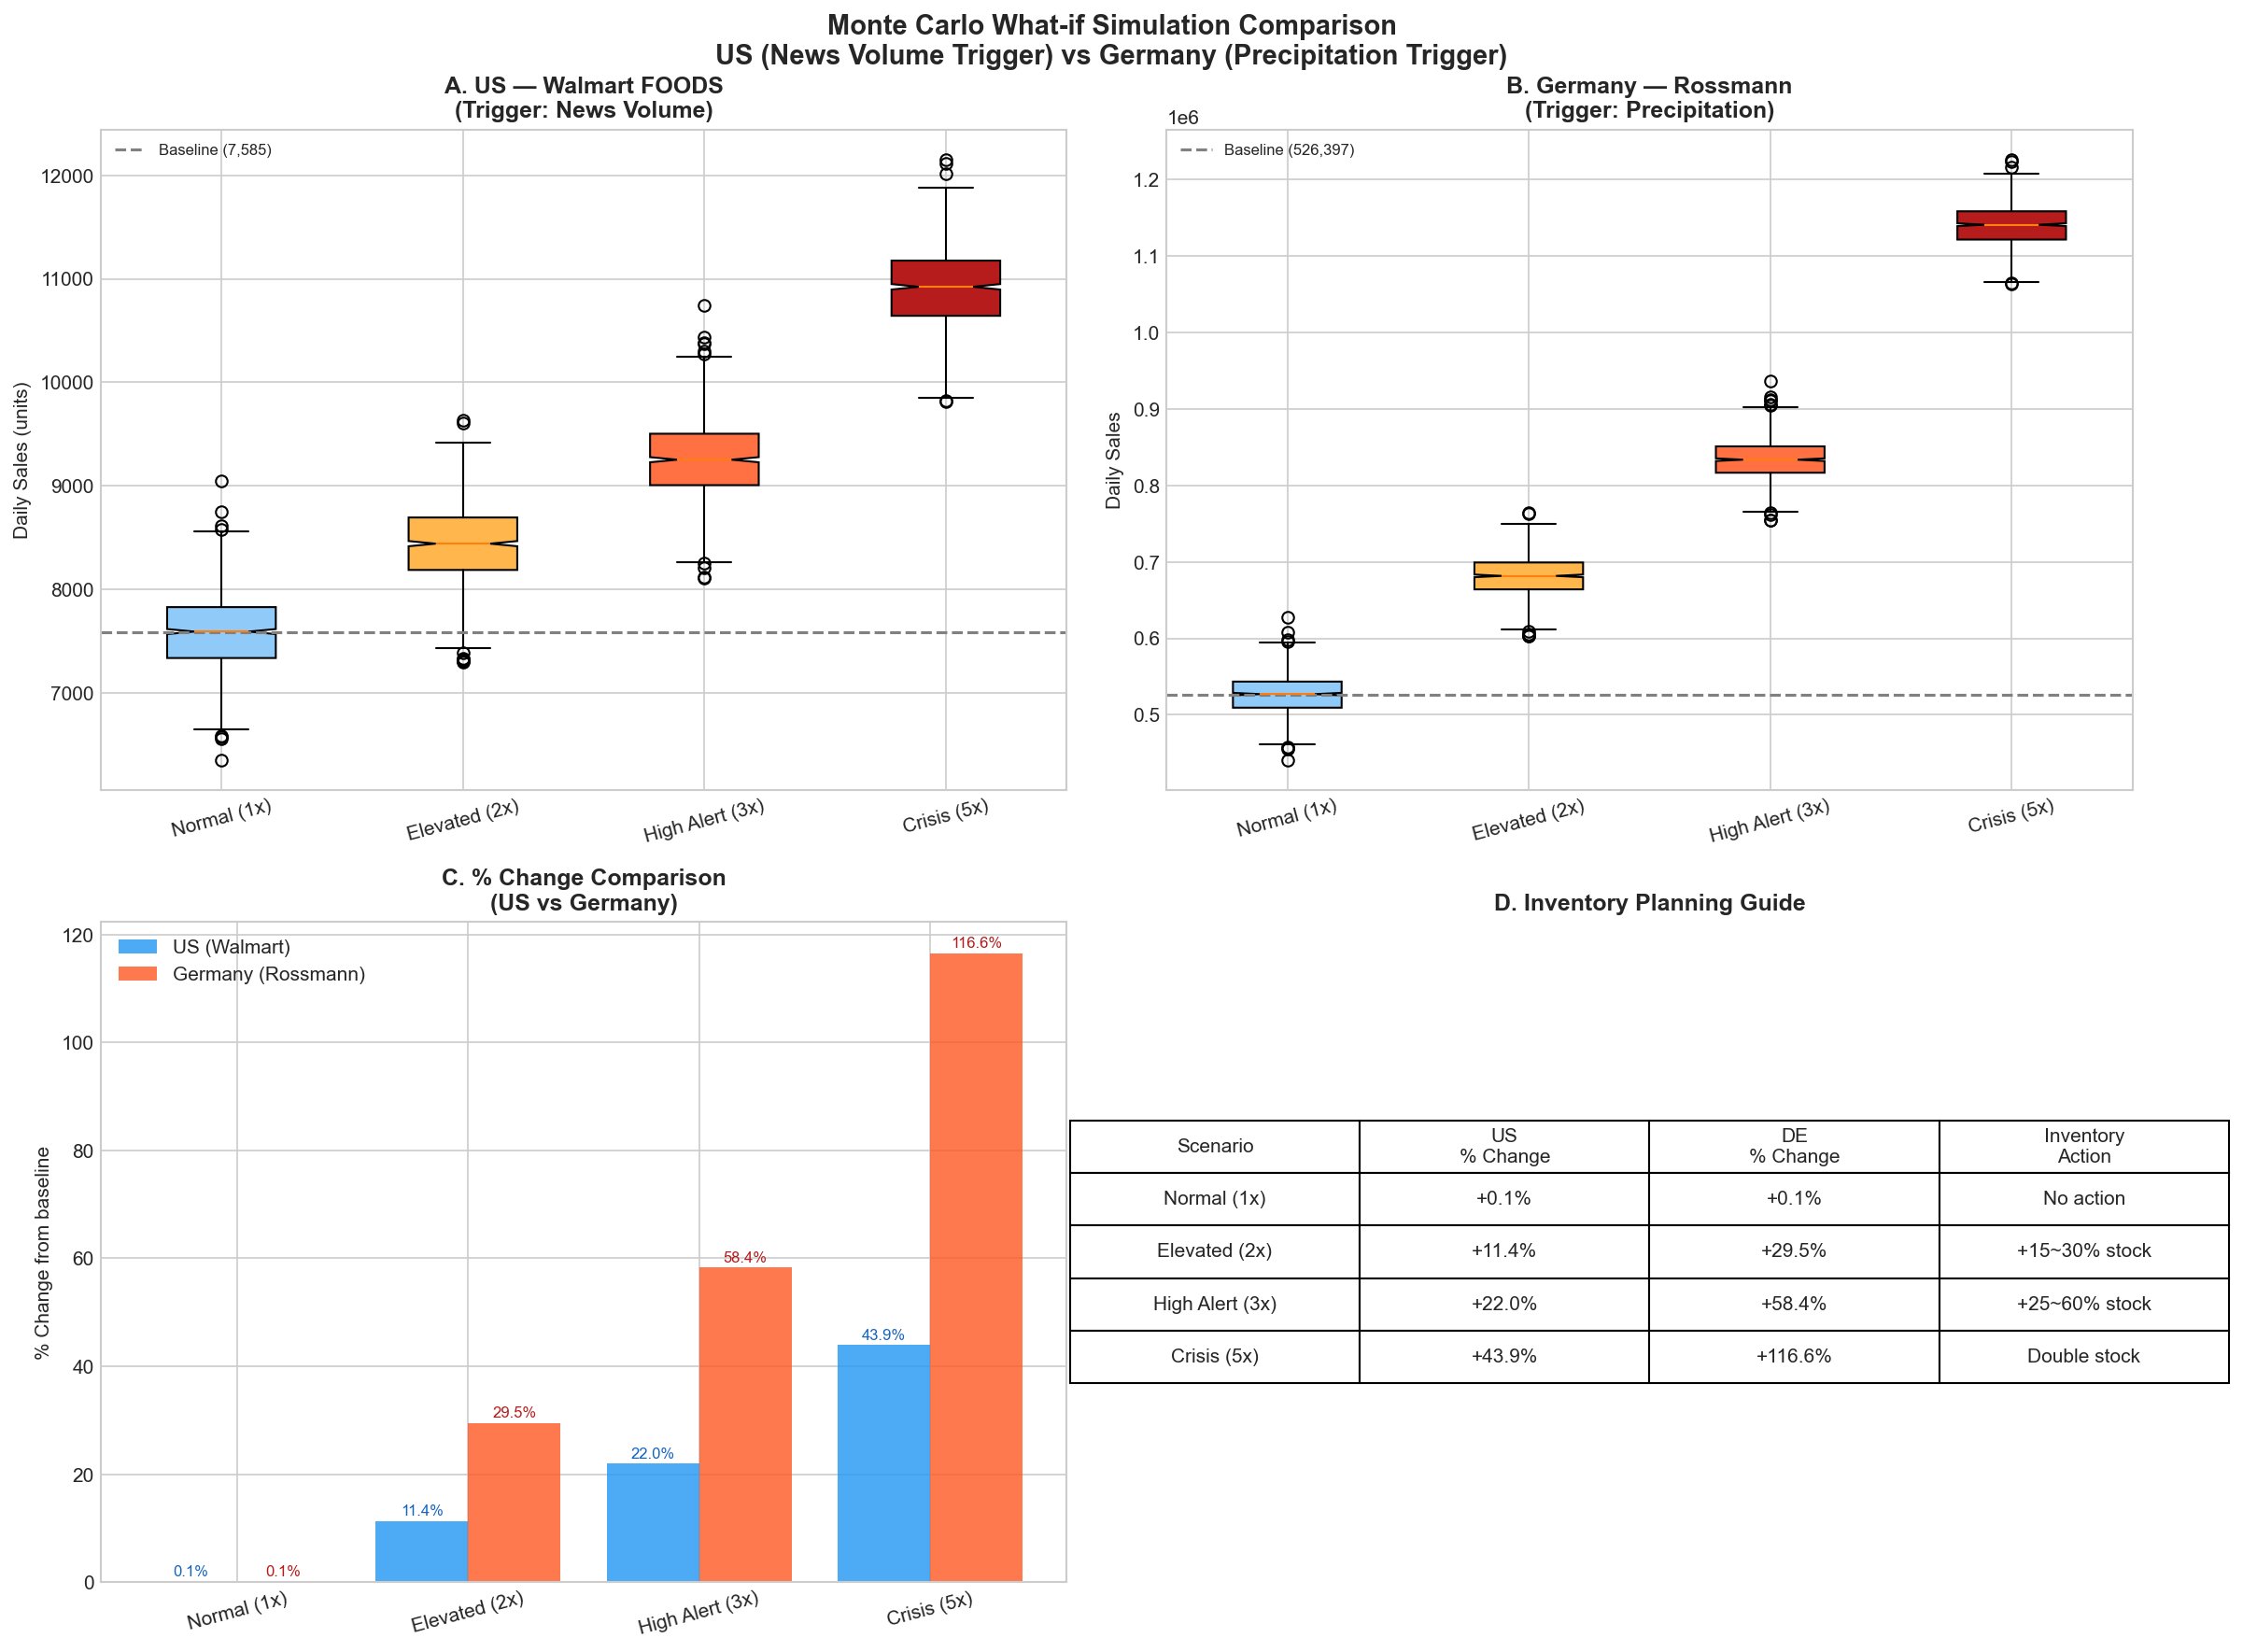
Figure 4. Monte Carlo What-if simulation. Crisis scenario (5x trigger): US +43.9%, Germany +116.6% demand increase. Germany flood generates a 2.7x stronger demand shock than US extreme cold.
Floods generate a 2.7x stronger consumer demand shock than extreme cold events. At Crisis level (5x), US retailers need 44% additional inventory. German drugstores need 117% additional inventory — more than double the baseline.
| Scenario | Trigger multiplier | US (cold) | Germany (flood) | Inventory action |
|---|---|---|---|---|
| Normal | 1x | +0.1% | +0.1% | No change |
| Elevated | 2x | +11.4% | +29.5% | Order +15–30% |
| High Alert | 3x | +22.0% | +58.4% | Order +25–60% |
| Crisis | 5x | +43.9% | +116.6% | Double stock |
4. The Business World Model Framework

Figure 5. Disaster-Type-Specific Retail Demand Framework. Consumer behavior laws extracted from two countries and two disaster types.
| Dimension | Extreme Cold (US) | Major Flood (Germany) | Business Implication |
|---|---|---|---|
| Leading indicator | GDELT news volume (1–2 days before) |
Physical signal (CAMEO disaster code 17) |
Different monitoring strategy per disaster type |
| TFT top feature | Past sales (95%) | Disaster events (95%) | Different ML signals learned |
| Geographic spread | Localized (affected area only) | Nationwide (fear spreads) | Flood requires national inventory adjustment |
| MC crisis shock | +43.9% | +116.6% | Flood = 2.7x stronger demand shock |
| Response timing | Monitor GDELT news → Act 1–2 days before |
Monitor weather/CAMEO → Act 3–5 days before |
Early warning system required |
5. Limitations and Next Steps
5.1 Current Limitations
- GDELT data coverage: Only 24–27 actual days collected per event window. Remaining dates were filled with mean values. GDELT-based lag features may be underestimated as a result.
- Single event per type: One case study per disaster type. Generalization requires validation across multiple events and geographies.
- Monte Carlo decoupled from TFT: Monte Carlo parameters were derived directly from EDA observations, not from TFT quantile outputs. Full integration is needed.
- One-directional pipeline: Only the first loop — observe, learn, simulate — is complete. The feedback cycle from actual decisions back into model retraining does not yet exist.
5.2 Next Steps: Toward a True World Model
- Gemini API text analysis: Collect actual news headlines from GDELT source URLs and extract disaster severity indices via Gemini API. Replace raw article count with semantically meaningful severity signals.
- Causal AI (DoWhy): Formally validate the causal direction from news volume to demand. Move beyond correlation to establish that news causes panic-buying.
- RL Agent (Capstone): Add a reinforcement learning agent on top of TFT + Monte Carlo. The agent simulates future states via TFT, learns optimal order quantities, and retrains TFT from actual outcomes. This completes the infinite cycle.
- Agentic demo deployment: Build an interactive web app where users input disaster type and location — the system automatically selects the monitoring strategy and delivers inventory recommendations in natural language.
Consumers move according to consistent behavioral laws, just like physical objects follow physical laws. When a disaster comes, they panic-buy. When news volume explodes, they feel urgency. When they are locked indoors, they cannot shop. Learning these laws, simulating scenarios virtually, and stocking the shelves before they go empty — that is what a Business World Model is designed to do.
This study is not a finished system. It is the first complete loop of an infinite cycle: observe, learn, simulate. In the next loop, an agent will be added, simulations will drive actual decisions, and the outcomes will feed back into retraining. The cycle continues.
Data Sources:
M5 Walmart Dataset — kaggle.com/competitions/m5-forecasting-accuracy
Rossmann Store Sales — kaggle.com/competitions/rossmann-store-sales
GDELT Project — data.gdeltproject.org (free, no API key required)
Rossmann supplemental data (weather, store_states) — files.fast.ai/part2/lesson14/rossmann.tgz
Key References:
LeCun, Y. (2022). A Path Towards Autonomous Machine Intelligence. Meta AI Research.
Goldman Sachs Global Institute (2026). When AI Learns How the World Works.
SocioVerse (2025). A World Model for Social Simulation Powered by LLM Agents. arXiv:2504.10157
Gartner (2025). Top Supply Chain Technology Trends for 2025.
The Jupyter notebooks and source code for this project are available upon request. Feel free to reach out via the contact page.