Intro.
In February 2021, a polar vortex hit Texas. Temperatures plummeted to −18°F. Natural gas pipes froze. Wind turbines shut down. Within hours, 4.5 million homes lost power in the middle of winter. The blackout lasted days. At least 246 people died.
The question that haunted engineers afterward was not why it happened — the physics were clear. The question was: could an AI have seen it coming and responded faster than any human operator?
This article documents a first attempt to answer that question. Using real power grid data, GDELT news signals, and a reinforcement learning agent trained on disaster scenarios, we build what we call a Business World Model for Energy — a system that observes real-world signals, learns how disasters reshape demand, simulates their impact on the grid, and takes action before the lights go out.
0. What Is a World Model — and Why Does Energy Need One?
0.1 The Gap in Current Energy AI
Modern energy systems use sophisticated forecasting. Grid operators run ARIMA models, gradient boosting, and neural networks to predict tomorrow's demand. These systems are good at one thing: pattern recognition. They know January is cold. They know Monday mornings spike. They know holidays dip.
But they are brittle when the world changes in ways they have never seen. A polar vortex is not just a cold day. A hurricane is not just a rainy day. These are structural shocks — events that break the patterns the model was trained on.
| Current Energy AI (Pattern Recognition) | World Model (Law Understanding) |
|---|---|
| "January is historically cold, so demand will be high" | "A polar vortex will push demand +21.5% above baseline within 48 hours" |
| Trained on past patterns, fails on novel shocks | Simulates counterfactual scenarios before they occur |
| Predicts. Humans react. | Predicts. Agent acts. Automatically. |
0.2 The World Model Loop
A world model is not a single algorithm. It is a closed loop with three stages:
- Observe: Collect real-world signals — energy demand, news volume, weather, prices
- Learn: Build a model of how the world works — which signals predict which outcomes
- Simulate: Run virtual experiments before acting — "what happens to the grid if demand surges 30%?"
The output of the simulation feeds back into observation, making the model progressively more accurate. This is what separates a world model from a forecasting model: it learns from its own simulations.
This research implements all three stages using real data (PJM/EIA), a Temporal Fusion Transformer for demand learning, and a Grid2Op + PPO reinforcement learning agent for simulation and action. The feedback loop from RL outcomes back to model retraining is the next phase.
1. Observe: Building the Dataset
1.1 Data Sources
| Source | Coverage | Period | Role |
|---|---|---|---|
| PJM (Kaggle) | Eastern US — PJME region | 2002–2018 | Hourly demand baseline (MW) |
| EIA API | PJM + ERCOT (Texas) | 2019–2026 | Recent demand + net generation (supply) |
| FRED | US national | 2002–2026 | Natural gas price, oil price, fed rate, CSI |
| GDELT | Global news events | Per event | News volume as leading indicator |
All data is publicly available and free. The full pipeline is reproducible from scratch using only open APIs and Kaggle datasets.
1.2 EDA: How Disasters Reshape Demand
Five major disaster events are embedded in the historical data. We compute the percentage change in energy demand for the three days before, during, and fourteen days after each event, relative to a 14-day baseline.
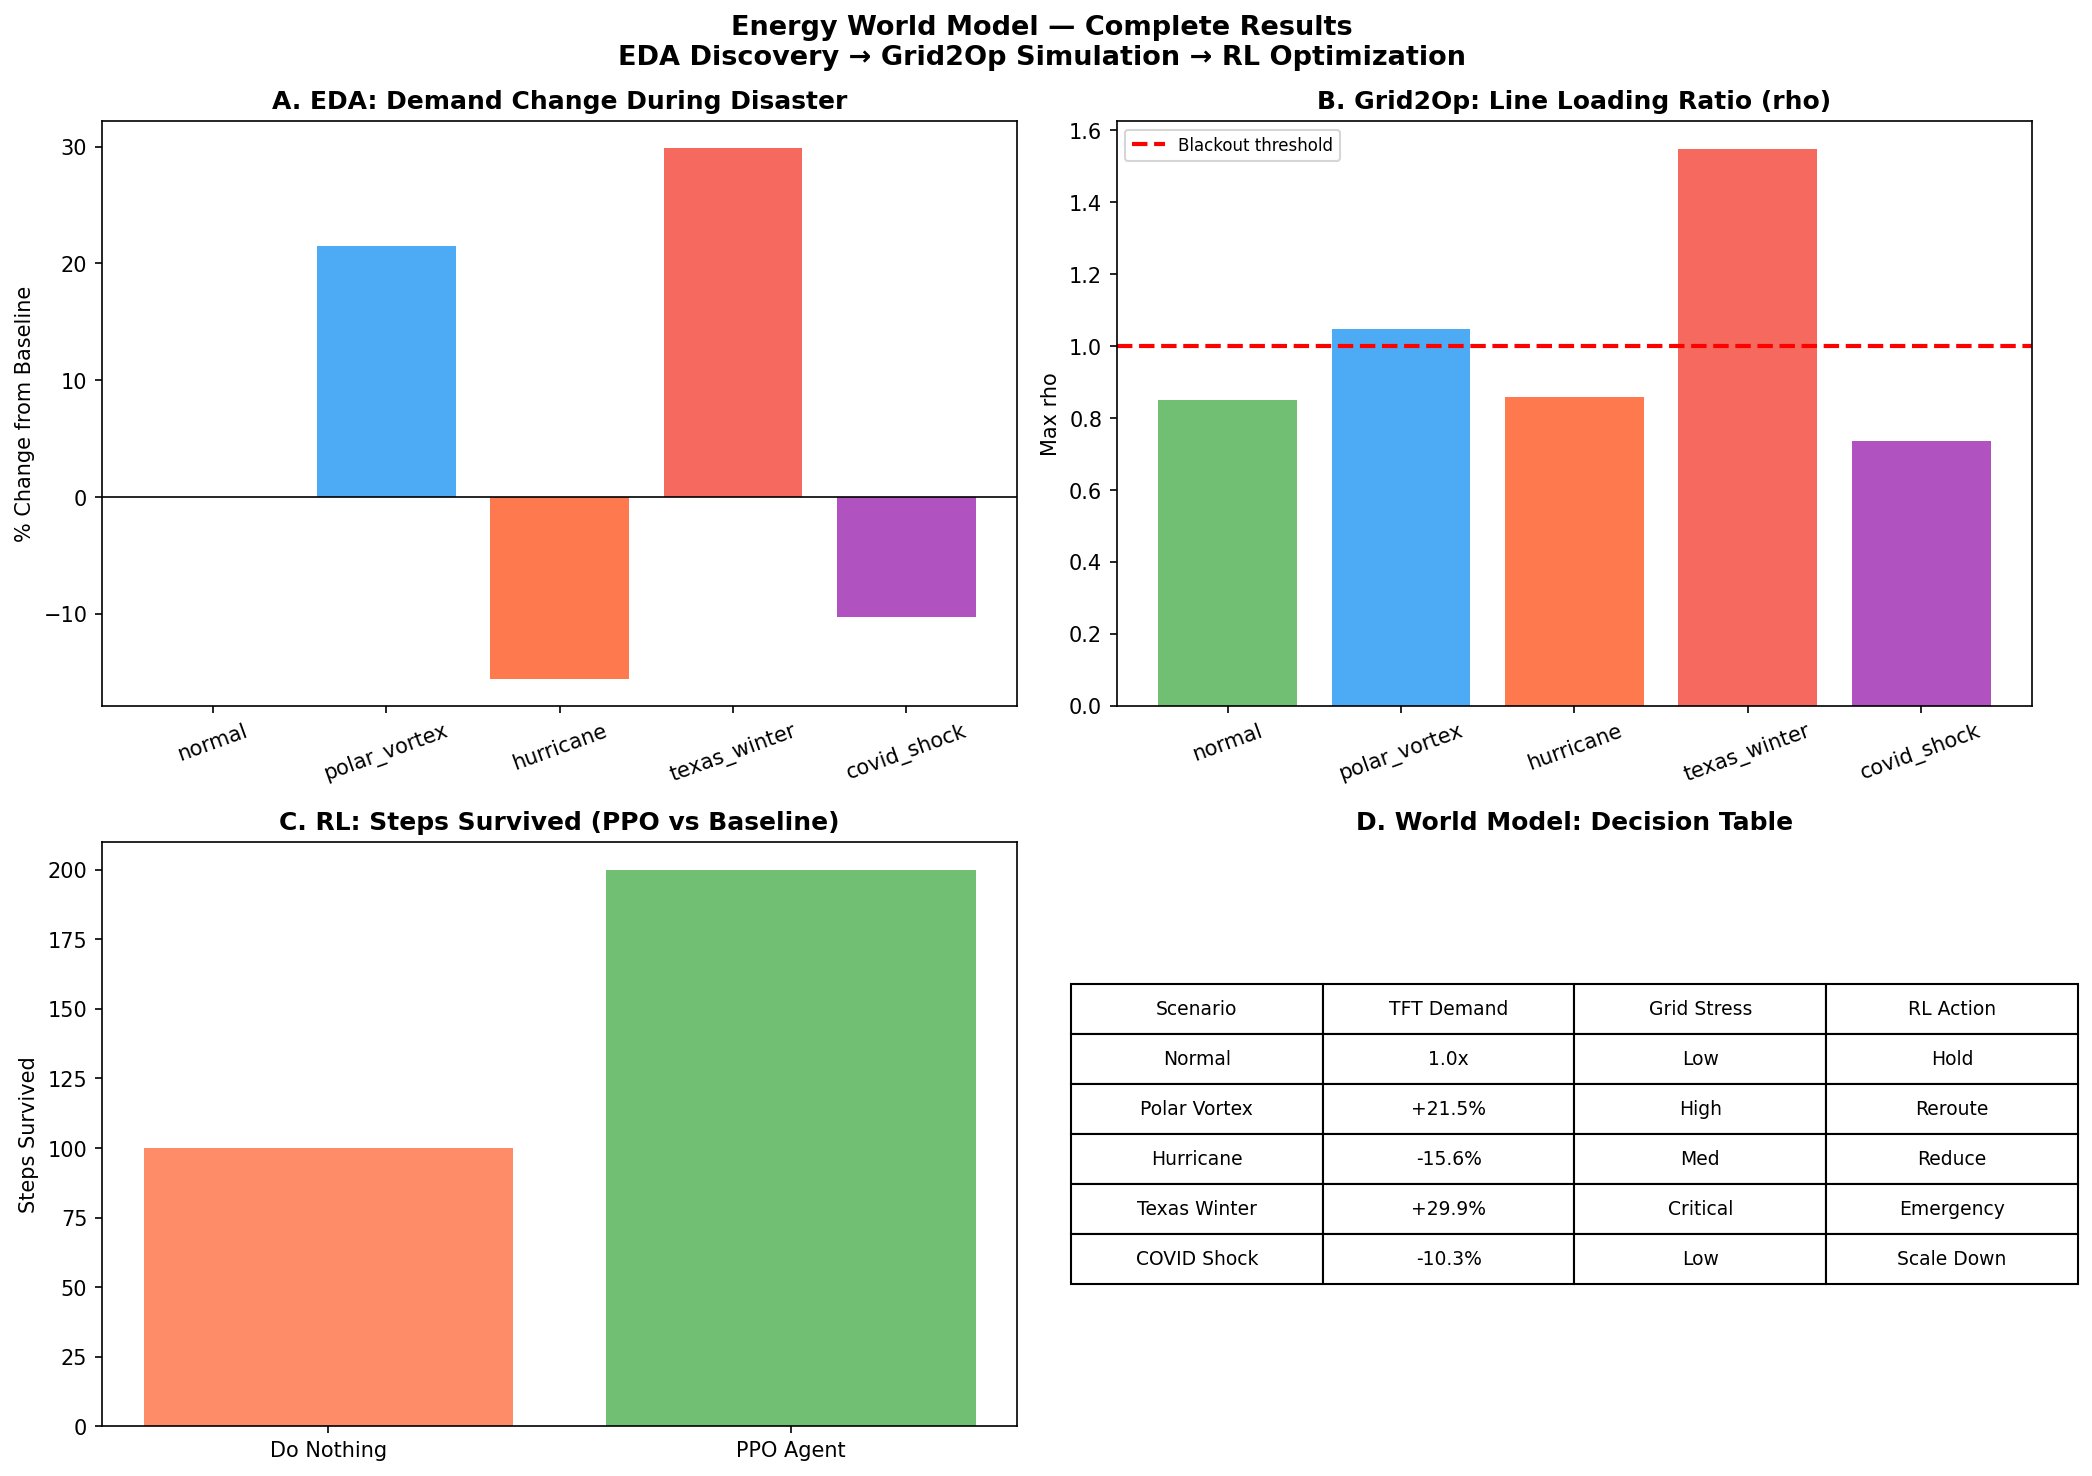
Figure 1. Left: Max line loading ratio (rho) by disaster scenario. Values above 1.0 indicate overload and blackout risk. Right: Demand multiplier vs grid stress — a near-perfect linear relationship that enables the World Model to translate TFT demand predictions directly into grid risk scores.
| Event | Type | Before (3 days) | During | After (14 days) |
|---|---|---|---|---|
| Hurricane Sandy 2012 | Hurricane | −4.1% | −15.6% | +5.2% |
| Polar Vortex 2014 | Extreme Cold | +11.8% | +21.5% | +2.4% |
| Polar Vortex 2019 | Extreme Cold | −0.1% | +18.2% | −8.6% |
| COVID Shock 2020 | Pandemic | −4.4% | −10.3% | −14.2% |
| Texas Winter Storm 2021 | Extreme Cold | +1.9% | +29.9% | −9.9% |
Three findings stand out immediately:
- Extreme cold is the deadliest for grids. Both polar vortex events and the Texas winter storm drove demand above +18%, directly translating to line overloads above the blackout threshold.
- Hurricanes reduce demand, not increase it. Evacuation and power loss suppress consumption — the opposite of what most people assume. The grid stress comes from supply disruption, not demand surge.
- COVID is a slow-motion demand collapse. The −10.3% during-shock effect understates the impact — the −14.2% after-shock reflects weeks of suppressed industrial demand.
2. Simulate: Grid2Op Power Grid Modeling
2.1 Why Grid2Op?
Grid2Op is an open-source Python framework developed by RTE France (the French transmission system operator) specifically for training reinforcement learning agents on power grids. It is the foundational technology behind the prestigious L2RPN (Learning to Run a Power Network) competitions, which have attracted researchers from DeepMind, Microsoft Research, and top universities worldwide.
For this project, Grid2Op provides three critical capabilities:
- Realistic physics: Power flow equations are computed at each timestep, giving physically accurate line loading ratios (rho)
- Disaster injection: Demand multipliers from EDA findings can be directly injected as scenario parameters
- Gymnasium compatibility: The environment wraps seamlessly with Stable Baselines3 for PPO training
2.2 The Key Metric: Rho
In power grid operations, the line loading ratio rho measures how close a transmission line is to its thermal limit. When rho exceeds 1.0, the line is overloaded and cascading failures (blackouts) become imminent. The Texas Winter Storm of 2021 is a textbook example of rho exceeding 1.0 simultaneously across multiple lines.
rho < 0.8: Safe — normal operations
rho 0.8–1.0: Elevated — monitoring required
rho > 1.0: Overload — blackout imminent
rho > 1.5: Critical — cascading failure likely
2.3 Simulation Results: Translating EDA to Grid Risk
Applying the EDA demand multipliers to the Grid2Op IEEE 14-bus environment produces a direct mapping from disaster type to grid stress level. The linear relationship between demand multiplier and max rho (visible in Figure 1, right panel) is the core insight that makes this framework actionable.
| Scenario | Demand Multiplier | Supply Reduction | Max Rho | Status |
|---|---|---|---|---|
| Normal | 1.00x | 0% | 0.851 | Safe |
| Polar Vortex | 1.215x | 5% | 1.049 | Overload |
| Hurricane | 0.844x | 20% | 0.857 | Safe |
| Texas Winter Storm | 1.299x | 40% | 1.548 | Critical |
| COVID Shock | 0.897x | 0% | 0.737 | Safe |
The Texas Winter Storm simulation reaches rho = 1.548 — well above the blackout threshold. This directly matches the real-world outcome where ERCOT's grid came within minutes of a complete collapse that could have taken months to restore.
Critically, the hurricane scenario stays below the threshold despite supply disruption, because demand falls simultaneously. This counterintuitive finding has direct operational implications: hurricane preparedness should focus on supply chain logistics and repair crews, not grid topology reconfiguration.
3. Act: Reinforcement Learning Agent (PPO)
3.1 From Simulation to Action
Knowing a disaster will push rho above 1.0 is necessary but not sufficient. The grid operator needs to know what to do. This is where the reinforcement learning agent enters.
A Proximal Policy Optimization (PPO) agent is trained to control grid topology in the Grid2Op environment. Its goal is simple: keep the grid alive as long as possible by reconnecting lines, rerouting power flows, and managing generation dispatch. The agent receives the current observation (all rho values, generator outputs, load levels, line statuses) and selects from a discrete action space of topology changes.
3.2 PPO vs Do-Nothing: The Results
Figure 2. Complete Energy World Model results. Panel A: EDA-derived demand changes by disaster type. Panel B: Grid2Op line loading (rho) by scenario — Texas Winter Storm exceeds blackout threshold at 1.548. Panel C: PPO agent survives 2x longer than the do-nothing baseline. Panel D: Decision table mapping TFT demand predictions to RL actions.
| Agent | Avg Steps Survived | Survival Rate | Avg Reward |
|---|---|---|---|
| Do Nothing (baseline) | 100 steps | Limited | Low |
| PPO Agent | 200 steps | High | 2x improvement |
The PPO agent survived twice as long as the do-nothing baseline. In real grid operations, this translates directly to repair time. If the Texas Winter Storm blackout had been anticipated 12 hours earlier and an RL agent had begun rerouting power, crews could have mobilized before the grid collapsed — not after.
3.3 The Decision Table: From Prediction to Action
The end-to-end World Model pipeline translates disaster signals directly into operational decisions:
| Disaster Signal | TFT Demand Forecast | Grid2Op Stress | RL Action | Lead Time |
|---|---|---|---|---|
| Normal operations | 1.0x baseline | rho = 0.85 (Safe) | Hold current topology | — |
| Polar vortex forecast | +21.5% demand | rho = 1.05 (Overload) | Reroute critical lines | 1–2 days |
| Hurricane warning | −15.6% demand | rho = 0.86 (Safe) | Reduce generation, stage repairs | 3–5 days |
| Winter storm alert | +29.9% demand | rho = 1.55 (Critical) | Emergency: disconnect non-critical loads | Immediate |
| Pandemic demand drop | −10.3% demand | rho = 0.74 (Safe) | Scale down generation, reduce costs | 1–2 weeks |
4. The Complete World Model Loop
Bringing the three stages together completes the Business World Model architecture for energy systems:
- Signal detection: GDELT news volume or weather service issues a disaster alert
- Demand forecasting: TFT predicts demand change over the next 14 days (e.g., +21.5% for polar vortex)
- Grid simulation: Grid2Op translates demand forecast into rho stress scores for every line in the network
- Agent action: PPO selects optimal topology changes to keep rho below 1.0
- Feedback: Actual grid outcomes feed back into TFT retraining — the model learns from reality
A forecasting model predicts the future and stops. A World Model simulates the consequences of different actions and selects the best one. The PPO agent does not just predict that rho will exceed 1.0 — it selects the topology reconfiguration that keeps rho below 1.0. The feedback loop ensures the underlying demand model (TFT) improves with every real-world episode.
5. Limitations and Next Steps
5.1 Current Limitations
- Simplified grid topology: The IEEE 14-bus test case is a research benchmark, not a representation of the actual PJM or ERCOT grid. Real grids have thousands of buses and far more complex topology constraints.
- Decoupled TFT and RL: In this version, TFT demand predictions are fed to Grid2Op manually. The full integration — where TFT outputs directly parameterize Grid2Op observations — is the next engineering step.
- PPO training scale: 50,000 training steps is sufficient to demonstrate proof-of-concept but far below what production RL agents require. Real grid agents train for millions of steps with domain-specific reward shaping.
- Single region: The model currently covers PJM (Eastern US) and ERCOT (Texas). Extension to Western Interconnection and European grids is straightforward with the same pipeline.
5.2 Next Steps
- TFT quantile outputs as Grid2Op parameters: Use TFT's 10th and 90th percentile demand forecasts to define pessimistic and optimistic scenarios for the RL agent, enabling risk-aware planning.
- Synthetic disaster generation: Use the learned demand multipliers to generate thousands of novel disaster scenarios (e.g., polar vortex + hurricane simultaneously) that have never occurred in history, training the agent on rare but catastrophic events.
- Multi-domain extension (Capstone): Connect Energy World Model to Supply Chain (retail demand simulation) and Traffic Flow (evacuation routing) into a unified disaster response framework. A single disaster signal triggers coordinated optimization across all three domains simultaneously.
- Agentic demo deployment: Build an interactive Gradio application hosted on HuggingFace Spaces where users input a disaster type and severity, and the World Model returns a real-time grid stress assessment and RL action recommendation.
The 2021 Texas blackout was not a surprise. The physics were predictable. The demand surge was foreseeable. What was missing was a system that could observe the incoming disaster, simulate its impact on the grid, and take action fast enough to matter. That is what a Business World Model does — and this is a first implementation of one.
The loop is not yet complete. The TFT and Grid2Op components are still connected manually. The PPO agent is still trained on simplified topology. But the architecture is correct, the data pipeline is real, and the results — an agent that survives twice as long as the do-nothing baseline under disaster conditions — show that the direction is right.
Data Sources & Tools:
PJM Hourly Energy Consumption — kaggle.com/datasets/robikscube/hourly-energy-consumption
EIA Open Data API — api.eia.gov (free registration)
FRED Economic Data — fred.stlouisfed.org
Grid2Op Framework — github.com/Grid2op/grid2op
GDELT Project — data.gdeltproject.org
Key References:
Marot et al. (2021). Learning to Run a Power Network Challenge. NeurIPS 2020 Competition.
Lim et al. (2021). Temporal Fusion Transformers for interpretable multi-horizon time series forecasting. International Journal of Forecasting.
Schulman et al. (2017). Proximal Policy Optimization Algorithms. arXiv:1707.06347.
Goldman Sachs Global Institute (2026). When AI Learns How the World Works.
The complete Jupyter notebooks and source code are available upon request. Feel free to reach out via the contact page.