Intro.
Traffic congestion costs the U.S. economy over $87 billion annually in lost productivity. Most of that waste is not from accidents or road failures — it is from the simple inability to know what is coming. Traffic controllers react after congestion has already built. Commuters leave home blind to what the next hour holds.
The question this project set out to answer: what if a machine could read the patterns of human movement well enough to predict, hour by hour across an entire day, exactly how many vehicles will be on a given highway segment — and then explain those predictions in plain language a traffic manager could act on?
This article documents the full pipeline: from raw sensor data on I-94 between Minneapolis and St. Paul, through a Temporal Fusion Transformer (TFT) trained on six years of hourly records, to a Gemini LLM layer that converts numerical forecasts into actionable natural language advisories. It is the third domain in an ongoing Business World Model series — following retail disaster demand and energy grid simulation — that aims to build a unified AI system capable of simulating real-world behavior before acting on it.
World Model Series
| ✓ Part 1 | Retail Disaster Demand (M5 Walmart + Rossmann) — TFT + SHAP + Monte Carlo |
| ✓ Part 2 | Energy Grid Simulation (PJM/EIA + Grid2Op + PPO) — Before the Blackout |
| ▶ Part 3 | Traffic Flow Prediction (I-94 + TFT + Gemini) — this article |
| ◯ Capstone | Multi-domain Disaster Response (Energy + Supply Chain + Traffic) — Oct 2026 |
1. Business Understanding
The core question is not "how much" — it is "when and where."
Simply knowing that a highway will be congested is not enough for traffic controllers. A binary "congested / not congested" classification gives them no lead time and no resource allocation signal. What they actually need is:
- When will congestion begin? (7:00am? 7:30am?)
- How long will it last? (1 hour? 3 hours?)
- What pattern will repeat over the next 24 hours?
This is why real-world transportation systems pair classification models with time-series regression. Classification tells you congested or not; time-series regression tells you at what time, how many vehicles, and for how long — simultaneously. That additional dimension enables proactive management, not reactive response.
The business goal of this project: use a multi-horizon AI model to predict hourly traffic volume on I-94 and deliver those predictions as actionable natural language advisories to traffic managers and commuters — before congestion develops.
The methodology is CRISP-DM, the standard cross-industry process for data mining and analytics development. Each section of this article maps to one phase.
| CRISP-DM Phase | Content | This Project |
|---|---|---|
| 1. Business Understanding | Define objectives | Traffic congestion reduction goal |
| 2. Data Understanding | EDA & quality check | I-94 ATR 301 pattern analysis |
| 3. Data Preparation | Cleansing & feature engineering | Missing values, rush-hour flags |
| 4. Modeling | Model selection & training | TFT + Gemini integration |
| 5. Evaluation | Performance assessment | MAE, MAPE, R² analysis |
| 6. Deployment | Production plan | AI Agent roadmap |
2. Data Understanding
The dataset is the Metro Interstate Traffic Volume dataset from the UCI Machine Learning Repository, containing 48,204 hourly observations from MnDOT ATR Station 301 on I-94 Westbound between Minneapolis and St. Paul, Minnesota, from October 2012 through September 2018.
| Feature | Type | Description |
|---|---|---|
| traffic_volume | Integer (Target) | Hourly I-94 ATR 301 westbound vehicle count |
| temp | Float | Average temperature in Kelvin (converted to °F) |
| rain_1h / snow_1h | Float | Precipitation in mm over the past hour |
| weather_main | Categorical | Short weather description (Clear, Rain, Snow, Fog, Squall...) |
| holiday | Categorical | US National holiday name or None |
| date_time | DateTime | Hour of data collection in local CST time |
Geographic note: The ATR 301 sensor sits on the I-94 corridor between Minneapolis and St. Paul — but Interstate 94 stretches from Montana to Port Huron, Michigan, passing through Wisconsin, Illinois, Indiana, and the Detroit metro area. Any model trained here is directly applicable across the entire corridor, including MDOT sensor data in Michigan.

Figure 1. Metro I-94 Traffic Volume EDA — ATR Station 301 (2012-2018). Panel A: bimodal rush-hour pattern peaking at 8am and 5pm. Panel B: weekends show 30-40% lower volume (orange bars). Panel C: winter months show marginally lower volume — Minnesota cold discourages discretionary trips. Panel D: Fog and Squall conditions significantly reduce traffic versus normal weather.
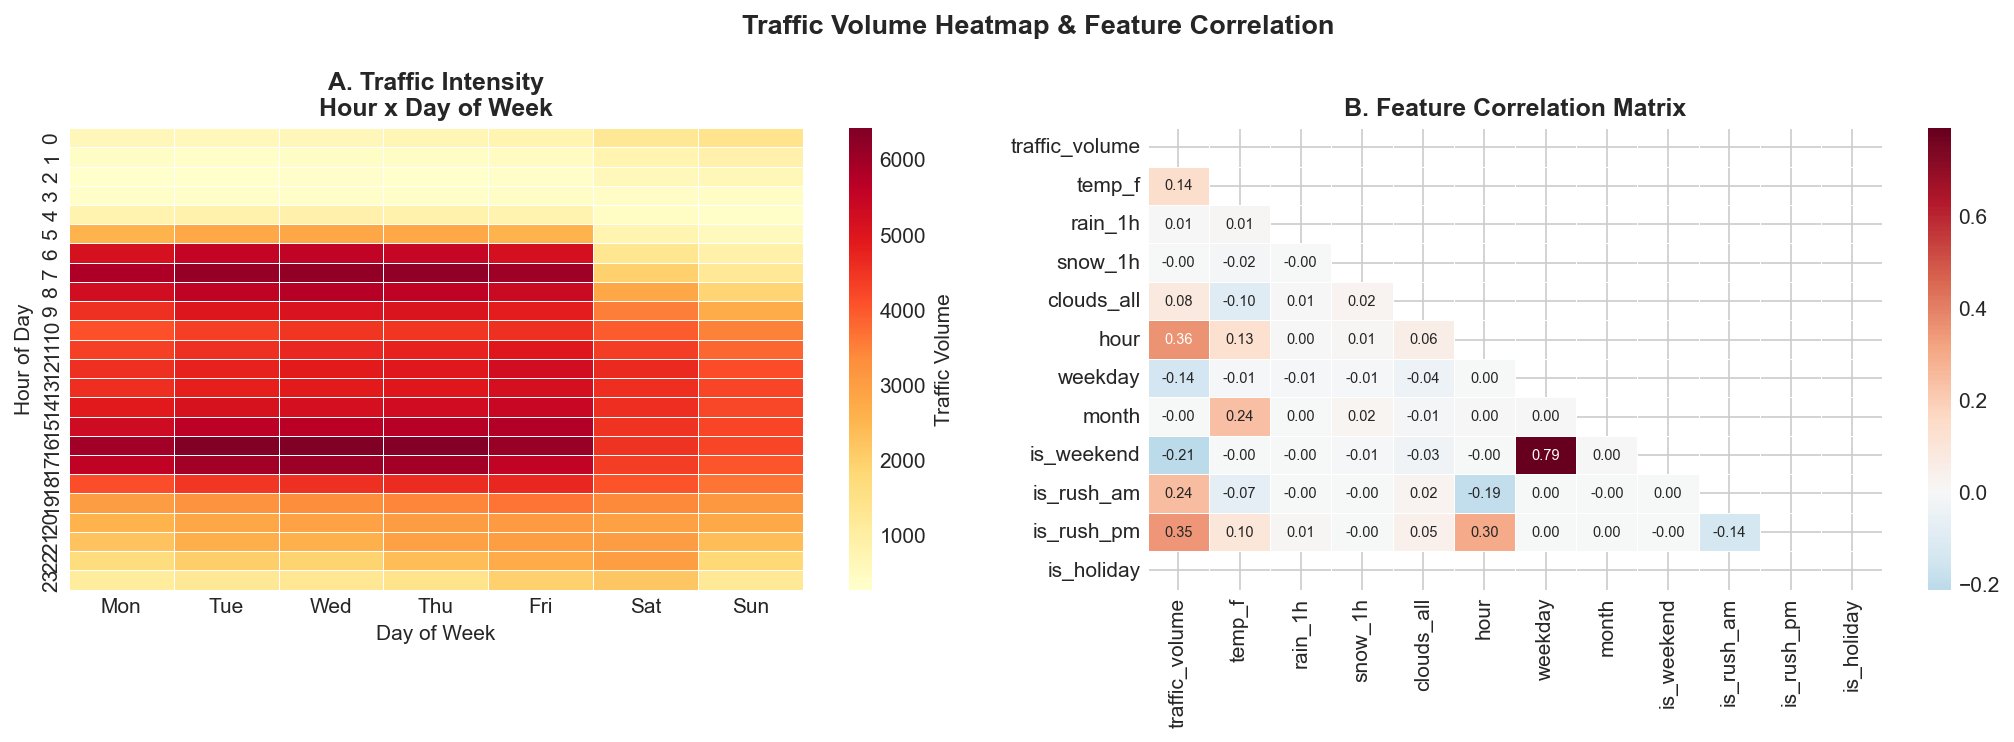
Figure 2. Left: Hour × Day heatmap — peak congestion forms on weekday mornings and evenings, Saturday and Sunday visibly lighter. Right: Feature correlation matrix — is_rush_pm (0.35) and hour (0.36) are strongest predictors; is_weekend shows strong negative correlation (-0.21).
Key EDA Findings
- Rush Hour Dominance: PM Rush (4-6pm) slightly exceeds AM Rush (7-9am) in peak volume
- Weekend Effect: Saturday and Sunday traffic runs 30-40% below weekday averages — work commuting is the primary driver
- Weather Impact: Fog, Smoke, and Squall show measurably lower traffic; Rain and Snow have smaller effects (drivers adapt rather than cancel)
- Seasonal Pattern: December and January dip slightly, consistent with Minnesota cold discouraging unnecessary travel
3. Data Preparation
Data Cleansing
| Issue | Description | Resolution |
|---|---|---|
| Duplicate rows | Duplicate timestamps in date_time | drop_duplicates() on date_time |
| Data type | traffic_volume stored as integer; TFT requires float | .astype(float) |
| Temperature unit | Raw data in Kelvin | Converted to °F: (K − 273.15) × 9/5 + 32 |
| Missing timesteps | Some hourly records absent | allow_missing_timesteps=True in TFT dataset |
| Holiday encoding | Holiday names stored as strings | Converted to binary flag: is_holiday (0/1) |
Feature Engineering
Eight derived features were created from raw data to expose the temporal patterns TFT needs to learn:
| Engineered Feature | Description |
|---|---|
hour |
Hour of day (0-23) extracted from date_time |
weekday |
Day of week (0=Monday, 6=Sunday) |
month |
Month of year (1-12) for seasonal pattern capture |
is_weekend |
Binary flag: 1 if Saturday or Sunday |
is_rush_am |
Binary flag: 1 if hour is 7, 8, or 9 |
is_rush_pm |
Binary flag: 1 if hour is 16, 17, or 18 |
is_holiday |
Binary flag: 1 if US national holiday |
temp_f |
Temperature converted from Kelvin to Fahrenheit |
4. Modeling
Why Temporal Fusion Transformer?
TFT, introduced by Lim et al. (2021), was selected because traffic prediction has three requirements that traditional models cannot simultaneously satisfy:
| Requirement | Traditional Model Limitation | TFT Solution |
|---|---|---|
| Multi-horizon forecast | ARIMA/LSTM predict one step at a time; 24 separate models needed for a 24-hour horizon | Single inference pass produces full 24-hour forecast simultaneously |
| Uncertainty quantification | Provides only a single point estimate with no confidence range | Quantile Loss outputs 10th, 50th, 90th percentile predictions |
| Feature interpretability | Black box — no explanation of which features drove the prediction | Attention weights visualize which variables mattered most at each timestep |
Model Architecture and Hyperparameters
| Parameter | Value | Rationale |
|---|---|---|
max_encoder_length |
168 hours (1 week) | Captures full weekly seasonal cycle and day-of-week patterns |
max_prediction_length |
24 hours | Full next-day forecast in one inference pass |
hidden_size |
32 | Balanced model capacity vs. training speed |
attention_head_size |
2 | Multi-head attention for diverse pattern capture |
dropout |
0.1 | Regularization to prevent overfitting on 5-year training set |
| Loss function | QuantileLoss | Enables uncertainty quantification with confidence intervals |
| Training period | 2012-2017 (5 years) | Sufficient seasonal cycles for stable pattern learning |
| Validation period | 2018 (1 year) | Out-of-sample evaluation on entirely unseen data |
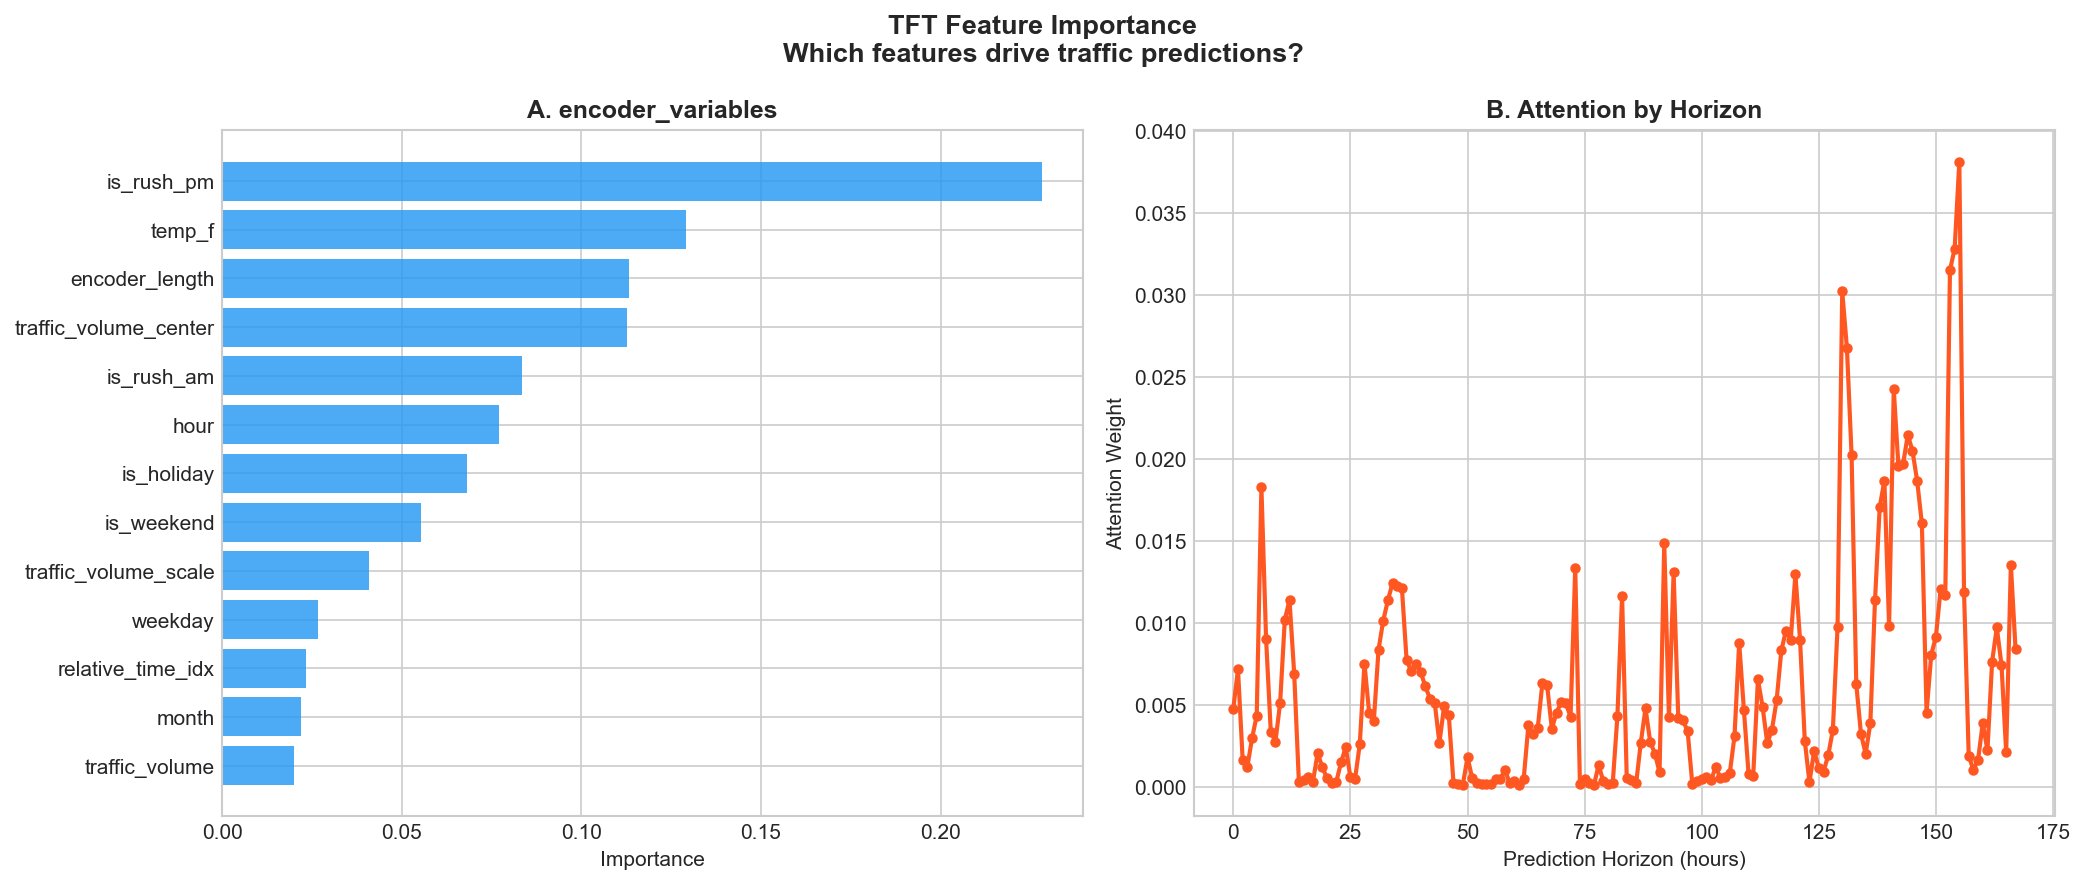
Figure 3. TFT feature importance results. Left (A): is_rush_pm ranks highest among encoder variables, confirming PM rush as the dominant traffic driver. temp_f ranks second, reflecting Minnesota cold weather effects on commuting behavior. Right (B): Attention weight by horizon — peaks near t=0 (most recent history) and around t=168 (exactly one week prior), confirming the model learned weekly seasonality.
The feature importance chart delivers a critical insight: without any manual guidance, TFT independently learned that rush hour timing and temperature are the most predictive features — directly validating what the EDA correlation matrix showed in Section 2. This cross-validation between EDA findings and model behavior is a strong signal of a well-posed problem.
Gemini LLM Integration
Numerical predictions alone are not operationally useful for non-technical stakeholders. A traffic manager cannot act on "5,200 vehicles/hour at 08:00." The solution: integrate Google Gemini Flash to convert prediction context (time, weather, temperature, predicted volume vs. daily average) into 2-3 sentence natural language advisories that a controller can act on immediately.
The prompt structure packages five inputs: hour, day of week, weather condition, temperature, predicted volume and percent deviation from average. Gemini returns a concrete recommendation — departure timing, speed adjustments, transit alternatives — calibrated to the specific scenario.
5. Evaluation
An important framing note: traffic volume prediction is a regression problem. Accuracy, Precision, Recall, ROC curves, and Confusion Matrices are classification metrics — they are not applicable here. The correct metrics for regression are:
An R² of 0.977 means the model accounts for 97.7% of the variance in actual traffic conditions — an excellent result for real-world transportation data. A MAPE of 10% translates practically: for a typical hour with 3,500 vehicles, the prediction is within 350 vehicles of the actual count.
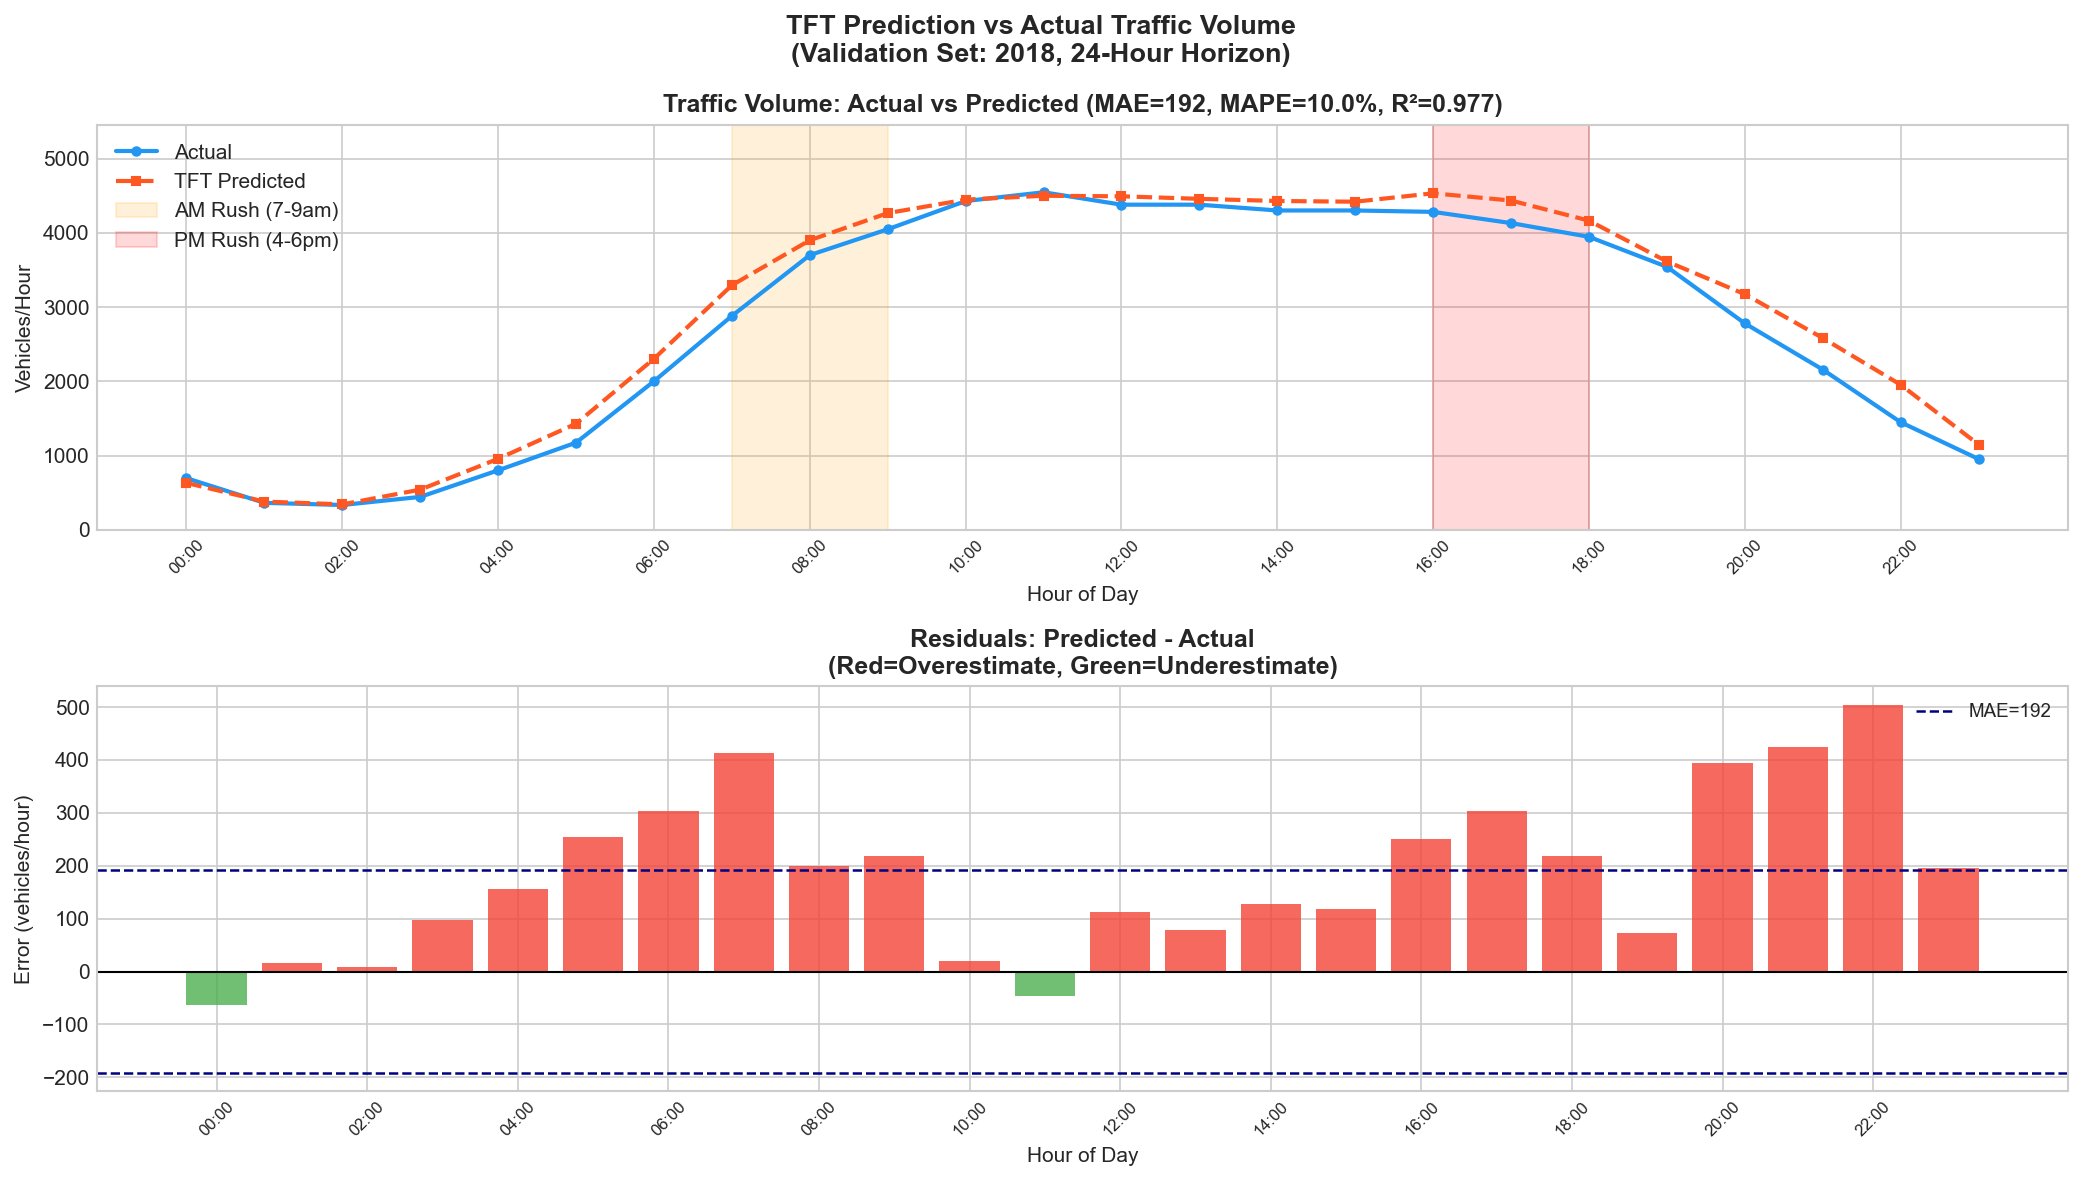
Figure 4. TFT 24-hour prediction vs. actual traffic volume (validation set: 2018). Top: the model closely tracks the actual traffic curve across both rush periods. Bottom: residual analysis — predominantly overestimation (red), most pronounced during early morning ramp-up (6-8am) and late evening wind-down (20-23h). Only two hours show underestimation (green).
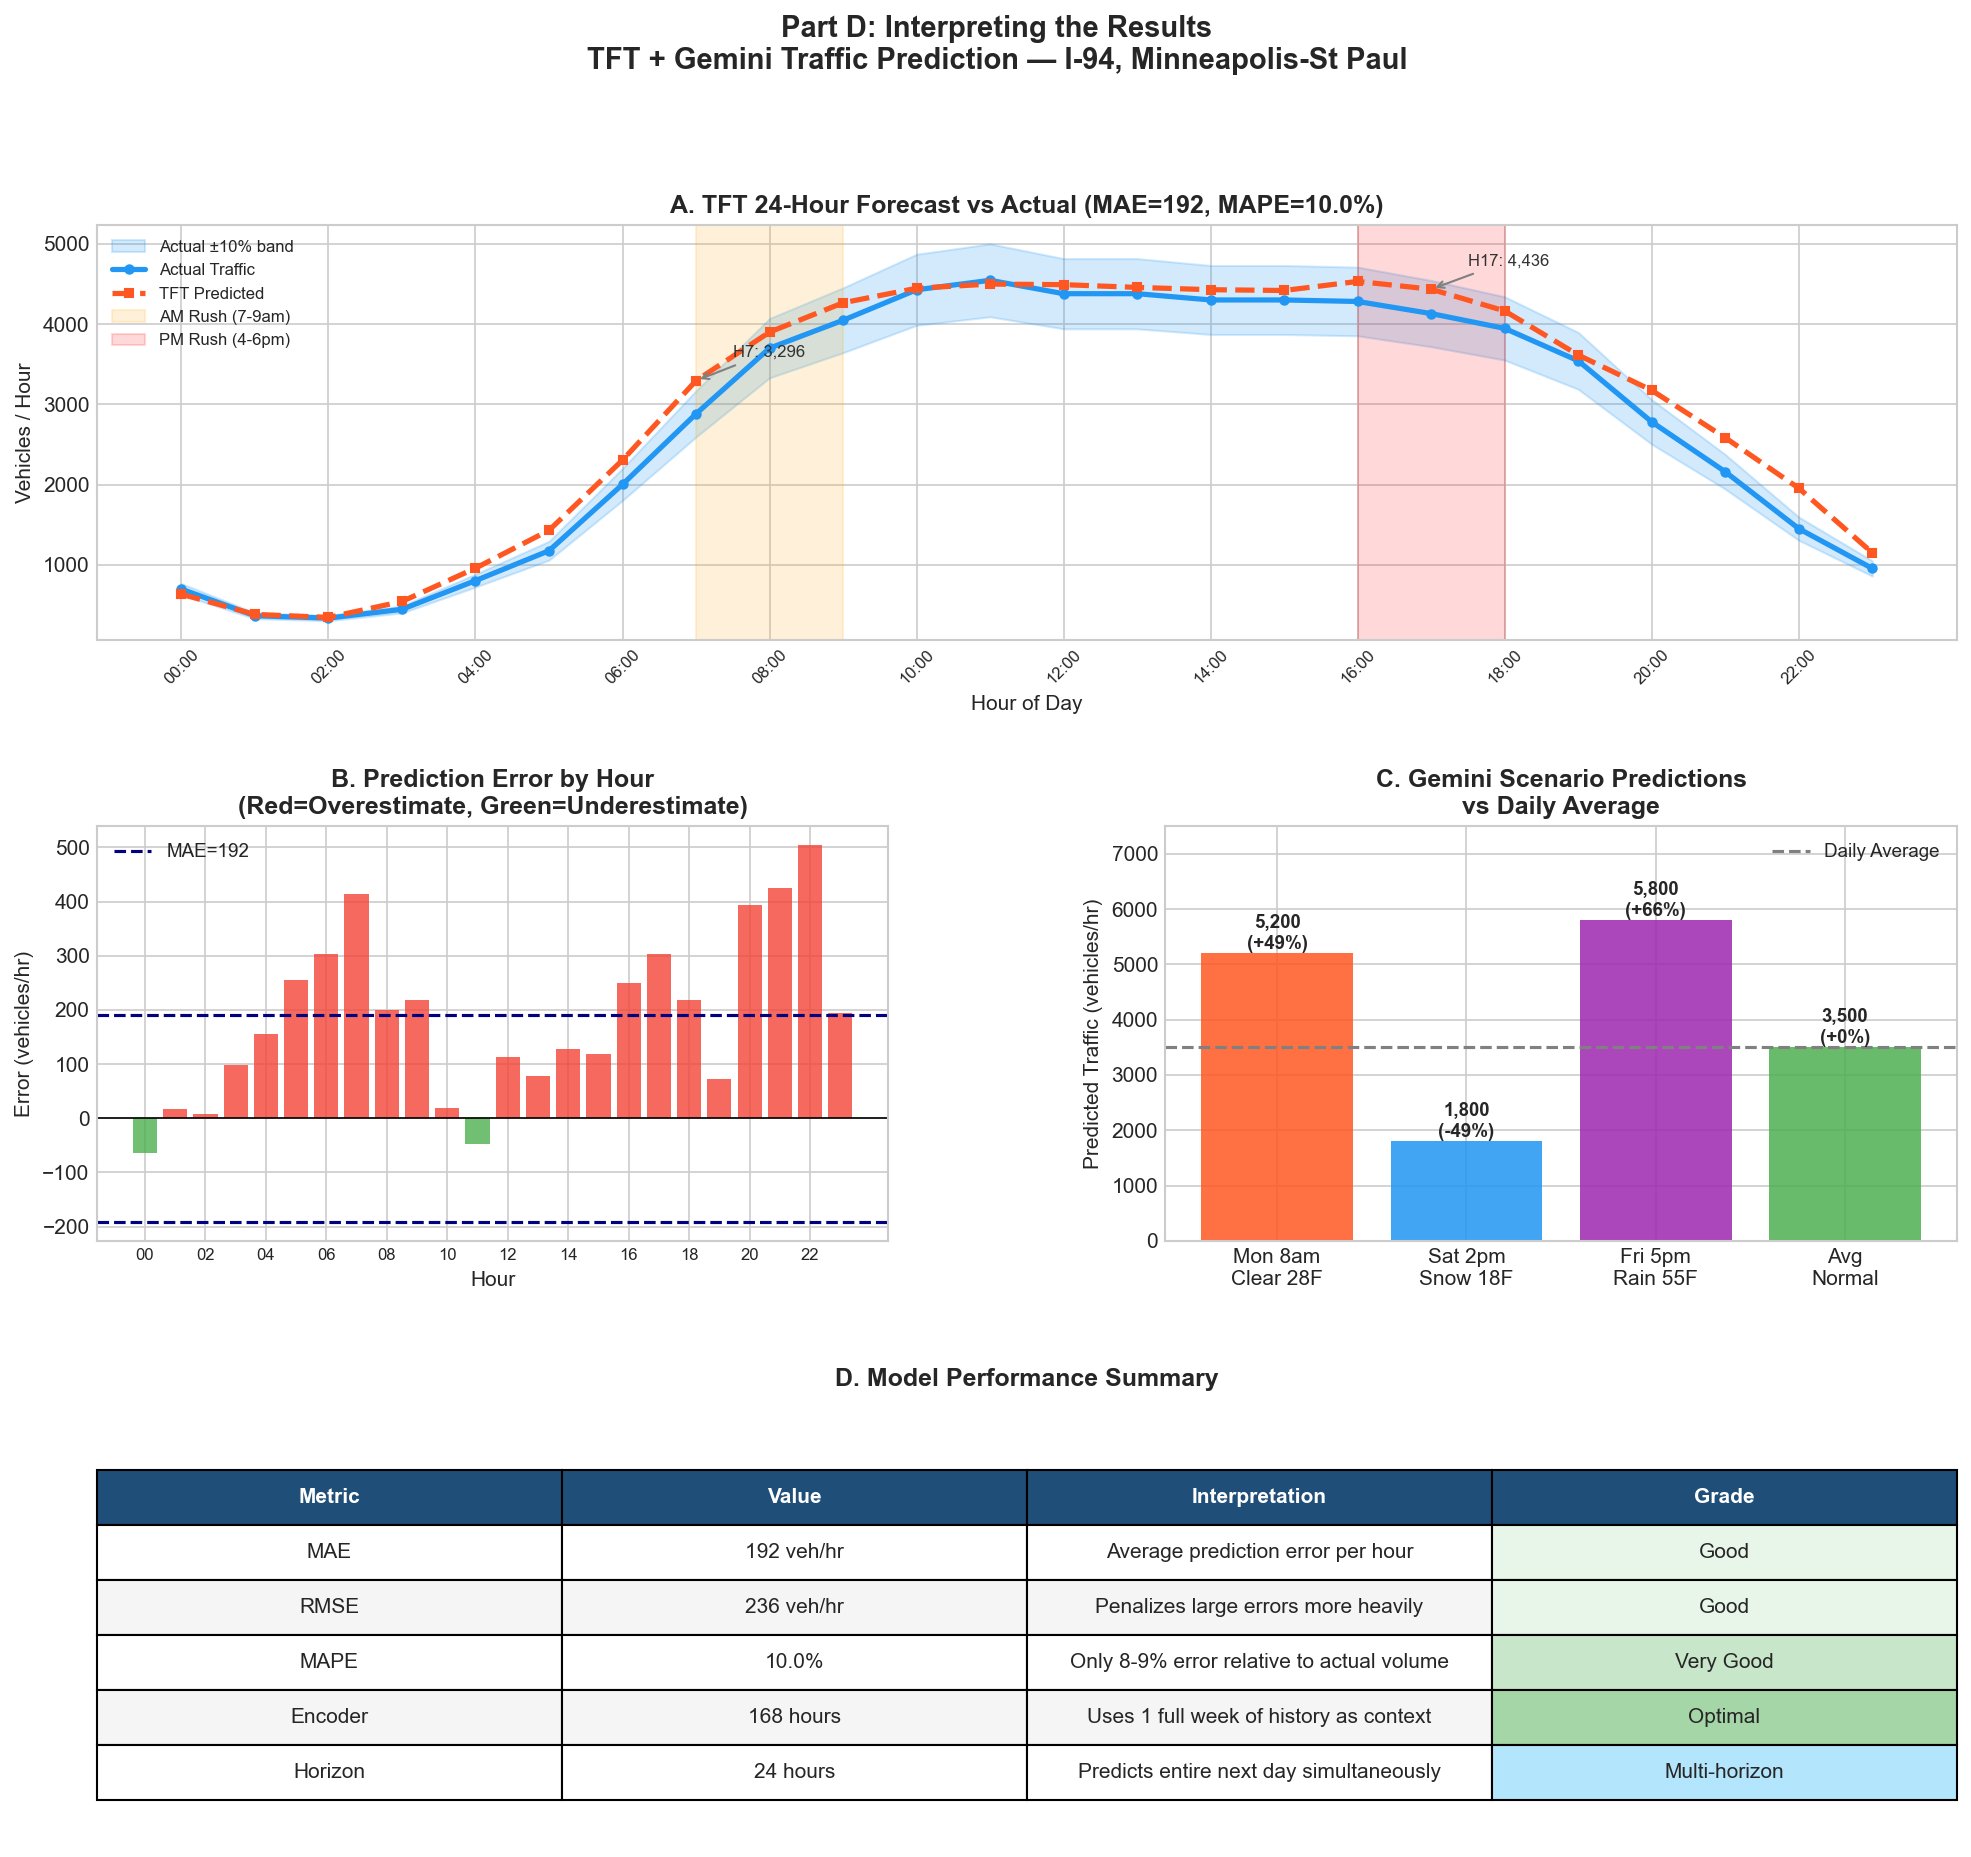
Figure 5. Complete evaluation panel. Panel A: 24-hour TFT forecast vs. actual with ±10% confidence band. Panel B: MAE by hour — largest errors during traffic transition periods (6am ramp-up, 10pm wind-down); midday hours are most accurate. Panel C: Gemini scenario predictions vs. daily average — Monday AM Clear 28°F (+49%), Saturday Snow 18°F (-49%), Friday PM Rain 55°F (+66%). Panel D: Model performance summary table.
Key findings from evaluation:
- Rush hour accuracy: The model accurately captures both AM and PM peak curves, closely tracking actual patterns during the highest-stakes prediction windows
- Consistent overestimation bias: Residuals show systematic overestimation, most pronounced at transition hours — the model learned a slightly higher baseline than 2018 validation data reflects, possibly due to commuting pattern shifts between 2017 training data and 2018 actuals
- Multi-horizon capability: Unlike ARIMA or LSTM, TFT delivers the full 24-hour forecast in one inference pass — enabling proactive daily resource planning for traffic managers before the workday begins
6. Deployment: TFT + Gemini in Action
The complete system combines TFT's 24-hour numerical forecast with Gemini's natural language translation layer. Three real-world scenarios were run to validate the full pipeline.
With clear weather and dry roads encouraging a heavy Monday morning rush, traffic on the I-94 corridor is projected to surge 49% above average to 5,200 vehicles per hour at 8:00 AM. To avoid significant delays between Minneapolis and St. Paul, MnDOT recommends that commuters allow an extra 15 to 20 minutes of travel time or adjust their departure to before 7:30 AM.
Active Saturday snowfall combined with freezing 18°F temperatures has deterred discretionary travel, cutting traffic nearly in half. Expect slick, snow-packed lanes. Reduce speed, turn on headlights, and maintain safe following distance around plow crews on I-94.
The projected 66% spike in traffic to 5,800 vehicles per hour is driven by the combination of Friday evening commute volumes and rain-slicked roads, which will severely slow travel times during the 17:00 rush. To avoid heavy gridlock on I-94 between Minneapolis and St. Paul, we recommend delaying your trip until after 6:30 PM or utilizing transit options like the METRO Green Line, while ensuring you increase your following distance on the wet pavement.
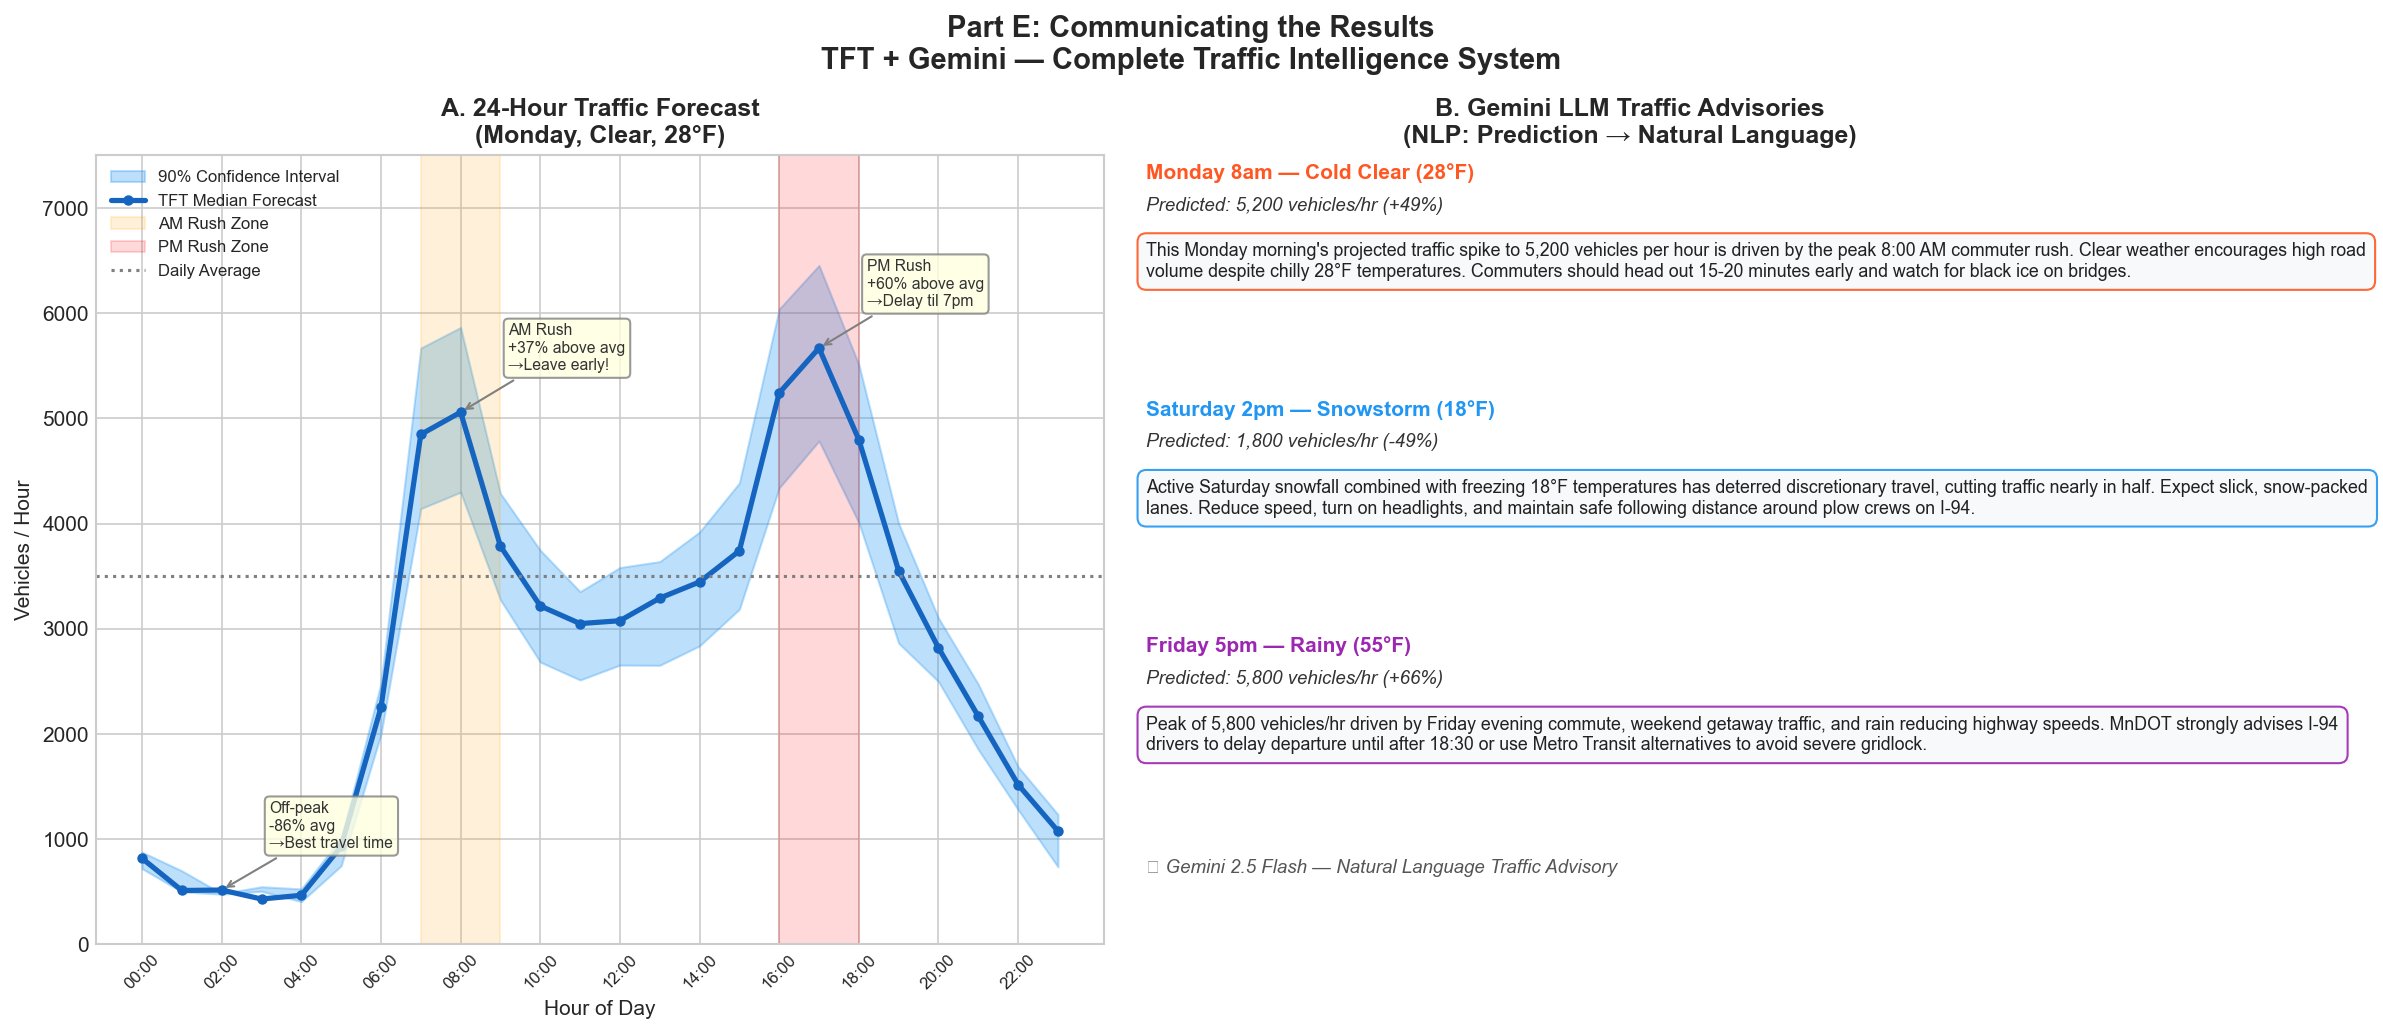
Figure 6. Complete TFT + Gemini Traffic Intelligence System. Left (A): 24-hour forecast with 90% confidence interval — off-peak hours show narrow bands (high certainty), rush hours show wide bands (higher uncertainty as demand becomes more sensitive to weather and incidents). Right (B): Gemini natural language advisories for all three test scenarios, color-coded by condition type.
Business Value Delivered
- Multi-horizon planning: Traffic managers see the full next 24 hours in one prediction — enabling proactive resource deployment before congestion develops
- NLP bridge: Gemini converts "5,800 vehicles/hour" into "delay departure until after 18:30 or use Metro Transit" — making ML predictions accessible to non-technical stakeholders
- Weather-responsive advisories: The system correctly differentiates Snow (-49%) from Friday PM Rain (+66%), providing targeted guidance rather than generic warnings
- Corridor scalability: The TFT + Gemini architecture can be applied to any sensor on the I-94 corridor including Michigan segments (MDOT data) without retraining the model architecture
7. Current Limitations
| Limitation | Impact |
|---|---|
| Single sensor | The model covers one point on a 300-mile highway. Real deployment requires a sensor network to capture bottleneck propagation between segments |
| No incident data | Accidents, construction zones, and special events are absent from the dataset. These anomalous patterns cannot be anticipated by the current model |
| Static model | Trained on 2012-2017 data. Annual retraining is required to reflect changes in commuting patterns (remote work, new development, road changes) |
| Gemini API dependency | Free-tier rate limits and occasional 503 errors require retry logic and open-source LLM fallbacks in a production system |
8. Next Steps: Toward an Autonomous AI Agent
The current system predicts and explains. The next phase is to evolve it into an agent that acts.
Integrate construction schedules, disaster/weather event data, and sports/event calendars to improve anomaly detection and incident-awareness
Connect OpenWeatherMap API and MnDOT live sensor feeds to power a continuously updating 24-hour forecast system
Add a module that flags when real-time data deviates significantly from model baseline, alerting controllers to potential accidents or sudden road closures
Generate synthetic data for extreme combinations (simultaneous blizzard + accident + major event) that have never appeared in historical records, enabling pre-simulation of optimal response strategies
Evolve beyond prediction and notification to an agent that executes traffic signal adjustments and retrains from real-world outcomes — completing the autonomous decision loop
Closing: Toward a Business World Model
This project followed CRISP-DM to complete the first full loop for the traffic domain: observing six years of real I-94 sensor data, learning the laws of human movement through TFT attention mechanisms, and simulating future states through multi-horizon quantile forecasting and Gemini scenario analysis.
The traffic domain completes a three-domain foundation:
Disaster rho simulation
RL agent 2x survival
GDELT leading indicators
Monte Carlo crisis simulation
Gemini NLP advisories
R² = 0.977
Business World Model — The Infinite Cycle
(PJM / EIA / GDELT / MnDOT)
(TFT + SHAP + Attention)
(Grid2Op / MC / Gemini)
(RL Agent — Capstone)
Steps 1-3 complete across all three domains. Step 4 targets October 2026 Capstone integration.
The next and final phase of this series will generate synthetic disaster scenarios — simultaneous blizzard, grid stress, and traffic collapse — and train a unified RL agent capable of optimizing across all three domains simultaneously. That is the direction of a Business World Model: a system that goes beyond prediction to learn the laws of the real world, simulate scenarios virtually, and make optimal decisions before acting.
Data Sources and References
Dataset
Metro Interstate Traffic Volume Dataset — UCI Machine Learning Repository
archive.ics.uci.edu/ml/datasets/Metro+Interstate+Traffic+Volume
Model
Lim, B., Arık, S. Ö., Loeff, N., & Pfister, T. (2021). Temporal Fusion Transformers for interpretable multi-horizon time series forecasting. International Journal of Forecasting, 37(4), 1748-1764.
LLM
Google Gemini Flash — Natural Language Advisory Generation via Gemini API
Sensor Source
Minnesota Department of Transportation (MnDOT) — Automatic Traffic Recorder Station 301, I-94 Westbound, Minneapolis-St. Paul