Part 3 — Validation & What Comes Next · Grading Against the Simulator, Not the Model
Part 2 ended on a question the previous post could not answer.
Every model here is trained on 31,960 rows the simulator produced. The planner consumes those models’ probabilities. The projections a grower would act on come out of the planner. So the whole stack rests on one thing being true: that the simulator behaves like an orchard.
Asking the outcome model whether it is right does not test that. It is the same model answering twice.
Four layers, each looking at something wider
| Layer | What it checks | Result |
|---|---|---|
| 1 | Against hand-computable values | 5 of 5 passed, to six decimal places |
| 2 | Physical invariants, propositions that must hold if the physics does | 19 of 20 passed, 1 undecided |
| 3 | Pipeline checks before any number is produced | 7 checks, automatic on every run |
| 4 | The plan, run back through the physics | 3,912 picks over 4.7 hours |
Table 1. Each layer down examines something broader than the one above it.
The first three check parts. Layer 4 checks the thing built out of the parts, and it is the only one that can catch an error the parts share.
One note on layer 2. Twenty of twenty-four invariants were applicable, nineteen passed, and the twentieth could not be decided. It is reported as undecided rather than dropped. Had all twenty-four been written up as passing, a reader would have grounds to suspect the tests were lax, and they would be right to.
Running the plan back through the physics
Layer 4 works like this. The planner chooses which fruit to attempt and in what order. Those choices go back into MuJoCo, which decides what actually happens. The outcome model takes no part in scoring.
3,912 picks. 4.7 hours of compute.
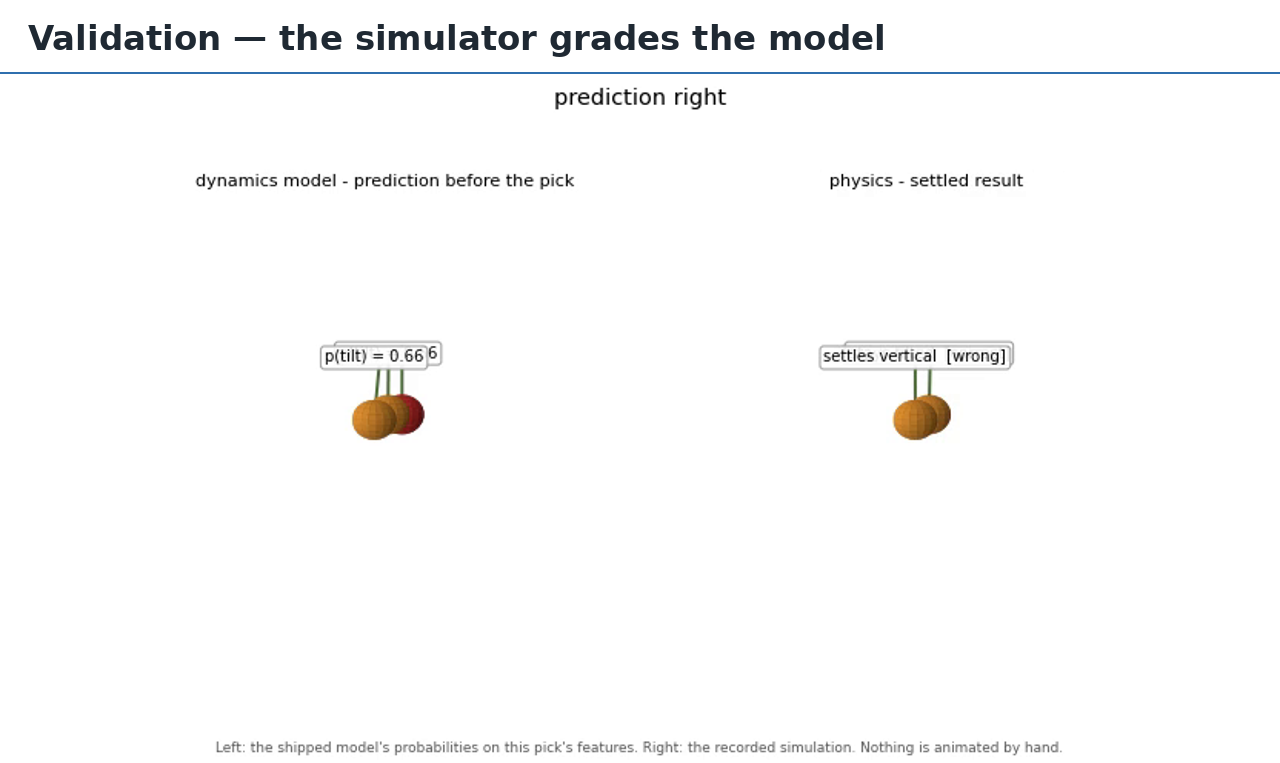
Figure 1. One pick from the validation run. Left: the shipped model’s probability for this fruit’s features. Right: what the recorded simulation did. The label reads wrong, because this is one the model got backwards.
The screenshot above is one pick from that run. On the left, the shipped model’s probability for this fruit’s features. On the right, what the recorded simulation did. Nothing is animated by hand, and the label on the right reads wrong, because that is one of the ones the model got backwards.
Showing the misses matters. A validation figure where everything agrees is not evidence of anything except which examples were chosen.
Six defects, all of them quiet
The comparison surfaced six defects during development. Not one of them raised an error. Not one of them produced summary statistics that looked odd.
One is worth telling in full.
During extraction, rotation values are converted into direction vectors. The order of the Euler axes was wrong, and the effect was that the stem was computed as pointing toward the camera rather than up the tree.
Every check a unit test would run came back clean. The vector had unit magnitude. The distribution looked plausible. No exception was thrown. Look at any single detection and nothing is out of place.
It surfaced in aggregate, on one line of a summary.
stems pointing up (stem_y > 0): 47.0%
Apples hang from branches. An upward stem is the normal case, and half of them pointing down is not something an orchard does. Correcting the axis order:
stems pointing up (stem_y > 0):  93.0%
median |stem_z|:  0.17   (no longer aimed at the lens)
That defect sat upstream of data generation, so everything after it was affected. The dataset was regenerated and every figure since is computed from the corrected manifest.
Fidelity is not a property of the model
The second finding came out of the same comparison, and it changed how the numbers are reported.
On the shipping configuration, predicted 0.788 against realised 0.730. A gap of 0.058.
Put a 0.9 selection threshold on the same model and the gap becomes 0.120. Same weights, same physics, twice the error.
Breaking it down by probability band shows why.
| Probability band | n | Predicted | Realised | Gap | |
|---|---|---|---|---|---|
| (0.95, 1.0] | 1,083 | 0.986 | 0.883 | −0.103 | optimistic |
| (0.9, 0.95] | 139 | 0.928 | 0.612 | −0.316 | optimistic |
| (0.8, 0.9] | 95 | 0.863 | 0.579 | −0.284 | optimistic |
| (0.0, 0.5] | 377 | 0.196 | 0.435 | +0.239 | pessimistic |
Table 2. Only the last row has the other sign.
The model is optimistic where it is confident and pessimistic where it is not. A threshold at 0.9 selects only the first three rows, so the optimistic bias is all that is left and the gap looks worse. Attempt everything and the last row comes in to offset it.
What the plan actually produces
With the environment checked, the output is worth stating plainly.
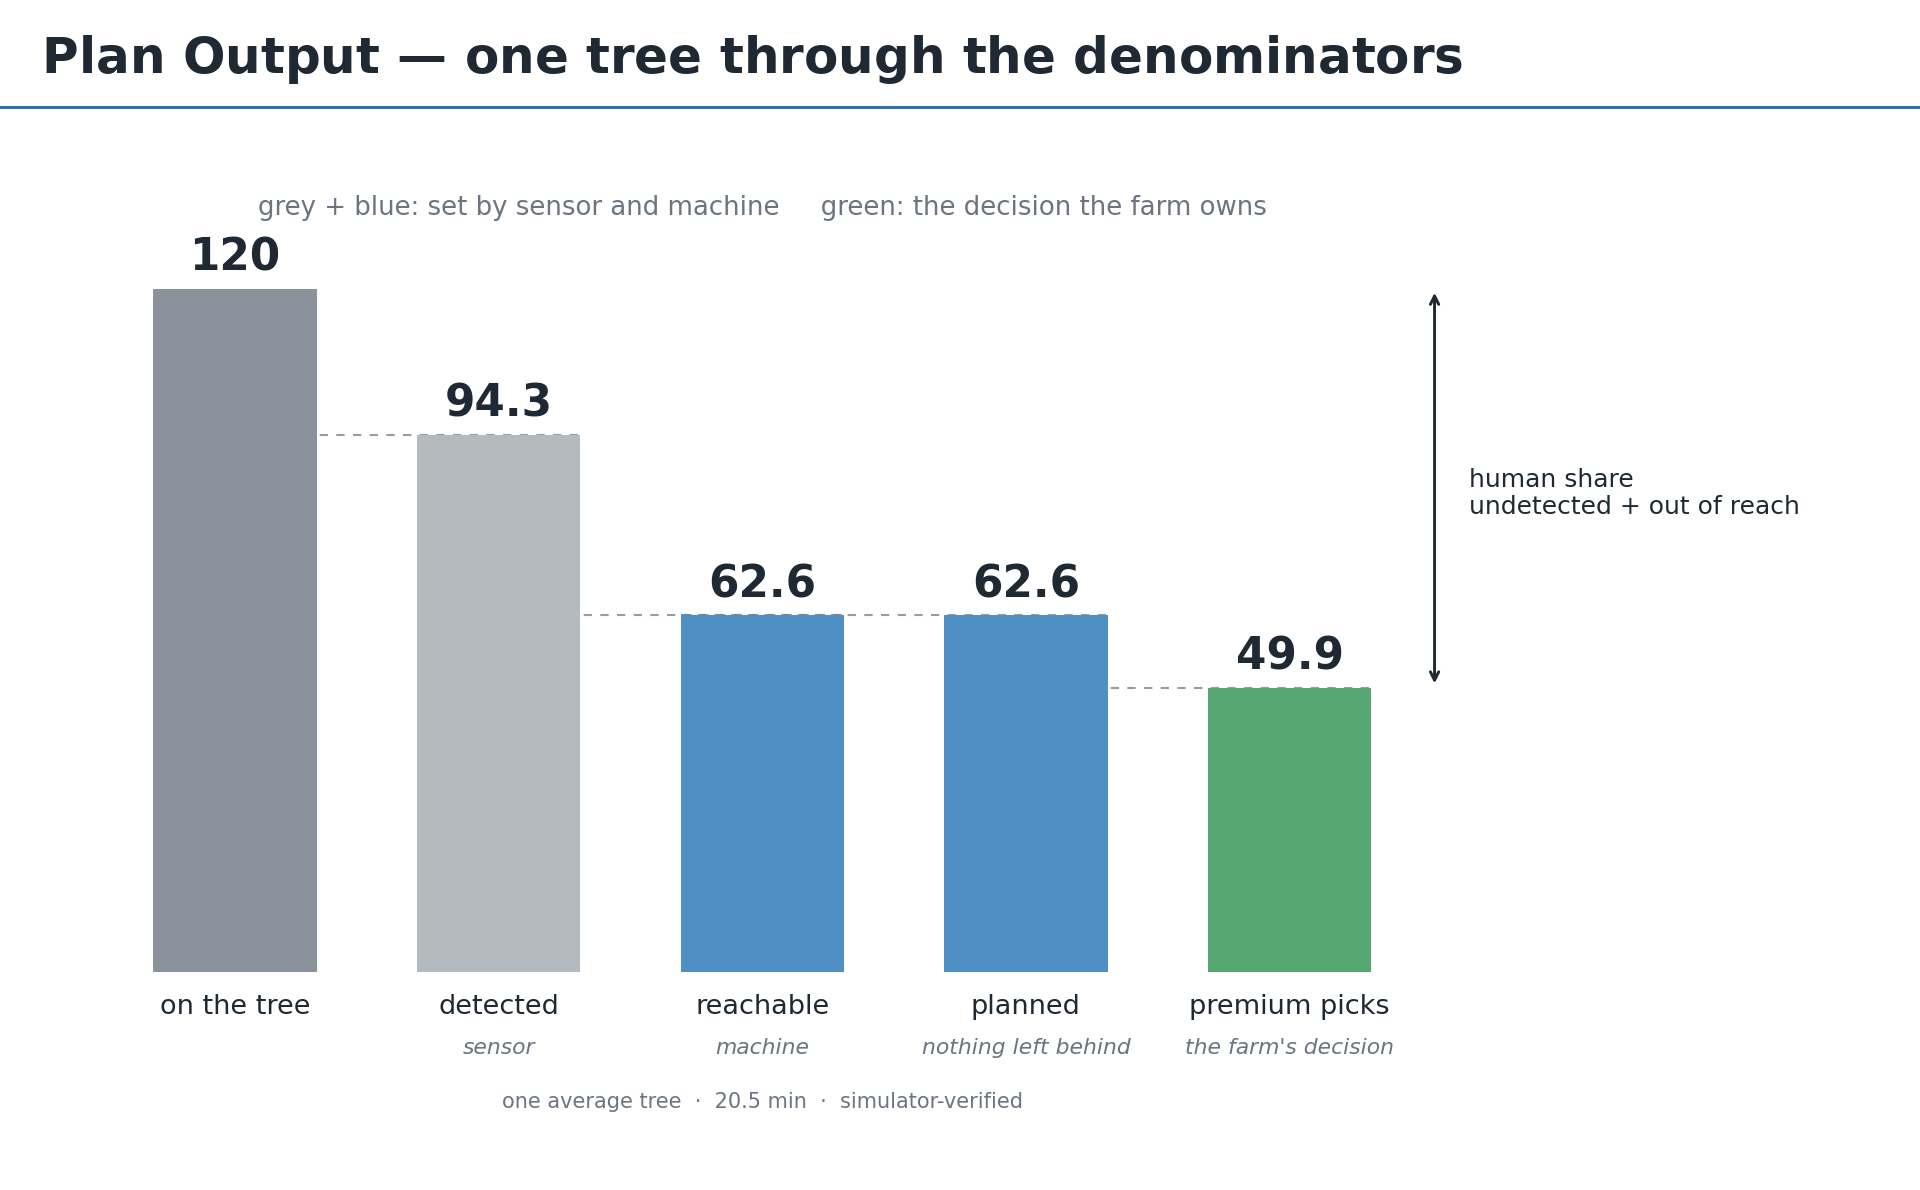
Figure 2. One tree through the denominators. The middle bars are set by the sensor and the machine; only the last step is a decision the farm owns.
on the tree             120.0
detected                 94.3    79%   foliage hides the rest
robot can reach          62.6    66% of detected
put in the plan          62.6   100% of reachable
premium, stem intact     49.9    80% of attempts
                       1,227 s  =  20.5 min per tree
The middle bars are set by the sensor and the machine. Only the last step is a decision the farm owns. “The robot picks about half the tree” collapses four different constraints into one number and hides which of them is worth spending money on.
Nothing reachable is left out. What carries to a second pass is what the camera could not see or the arm could not get to, not something the algorithm discarded.
From one tree to a block
A tree is the unit the planner works in. A block is the unit a grower schedules in.
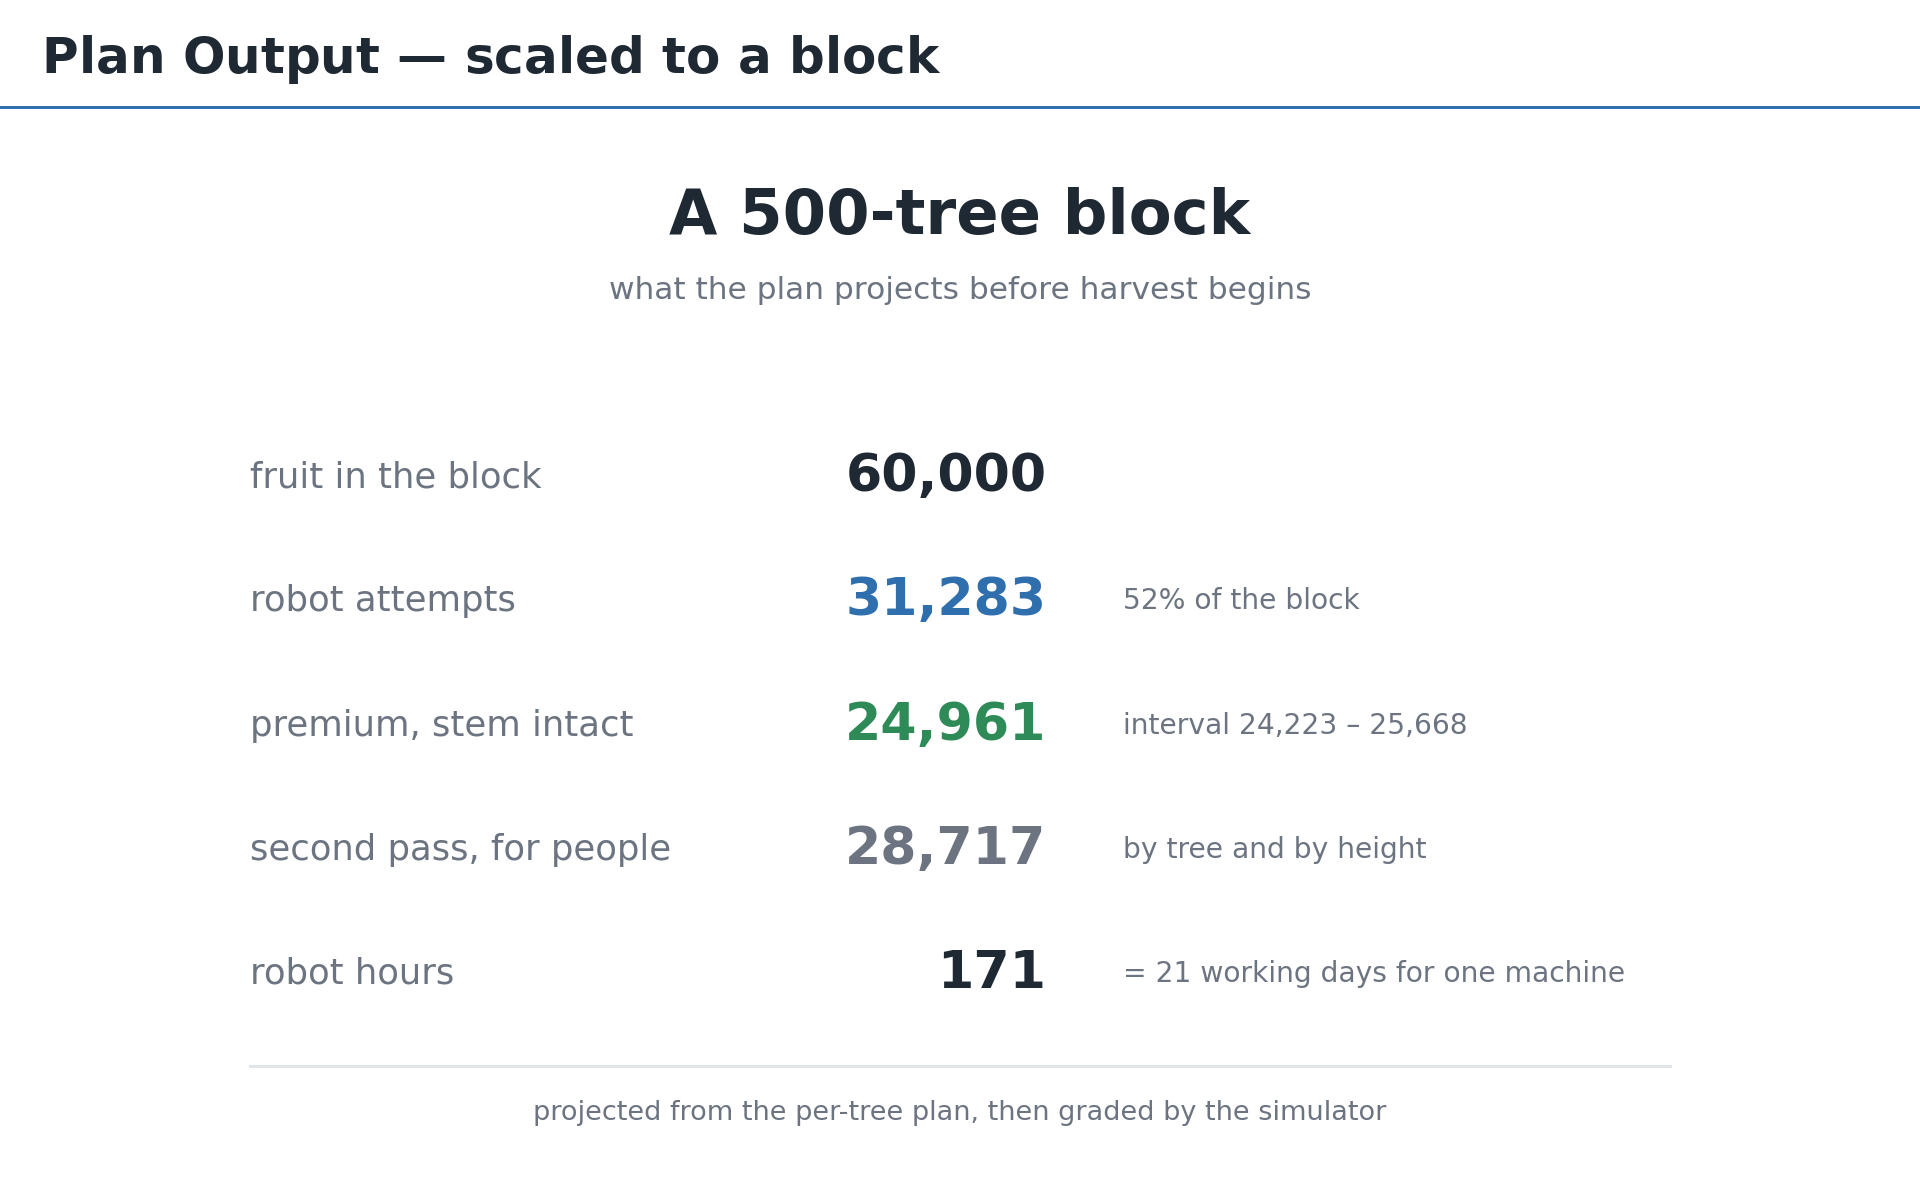
Figure 3. The 500-tree block projection. Intervals come from thirty seeds rather than a single run.
fruit in the block        60,000
robot attempts            31,283   52%
premium, stem intact      24,961   [24,223 – 25,668]
second pass               28,717   12,867 undetected
                                   15,850 out of reach
                                        0 unplanned
robot hours                  171   [166 – 176]  =  21 working days
The intervals come from thirty seeds rather than a single run.
The last line of the second-pass breakdown is the one that matters. Zero unplanned means the split between the machine and the second pass is decided by the sensor and the arm, not by the algorithm giving up. A grower scheduling labour knows which trees and which heights are theirs before the season starts.
One thing this is not: a comparison. The report does not claim the robot beats a person at anything. Skill, tooling and orchard practice vary too much for a single number, and the published figures have unclear denominators. What the projection gives is the machine’s half of the arithmetic, stated clearly enough that a farm can put its own numbers against it.
The last check before the robot moves
Numbers are one thing. Watching the plan run is another.
Video. The replay renders the canopy, drives the base from stop to stop, and plays every pick back from the physics log. Nothing is animated by hand.
The replay renders the canopy, drives the base from stop to stop, and plays every pick back from the physics log. Nothing is animated by hand, so what appears on screen cannot disagree with what was computed.
That matters more than it sounds. On paper a plan is “24 stops, 68 picks, 21.8 minutes.” On screen you can see whether the routing is sensible, whether the arm is doubling back, and whether the coverage is even. It is the last thing a grower would look at before letting a machine into a block.
What came out of it
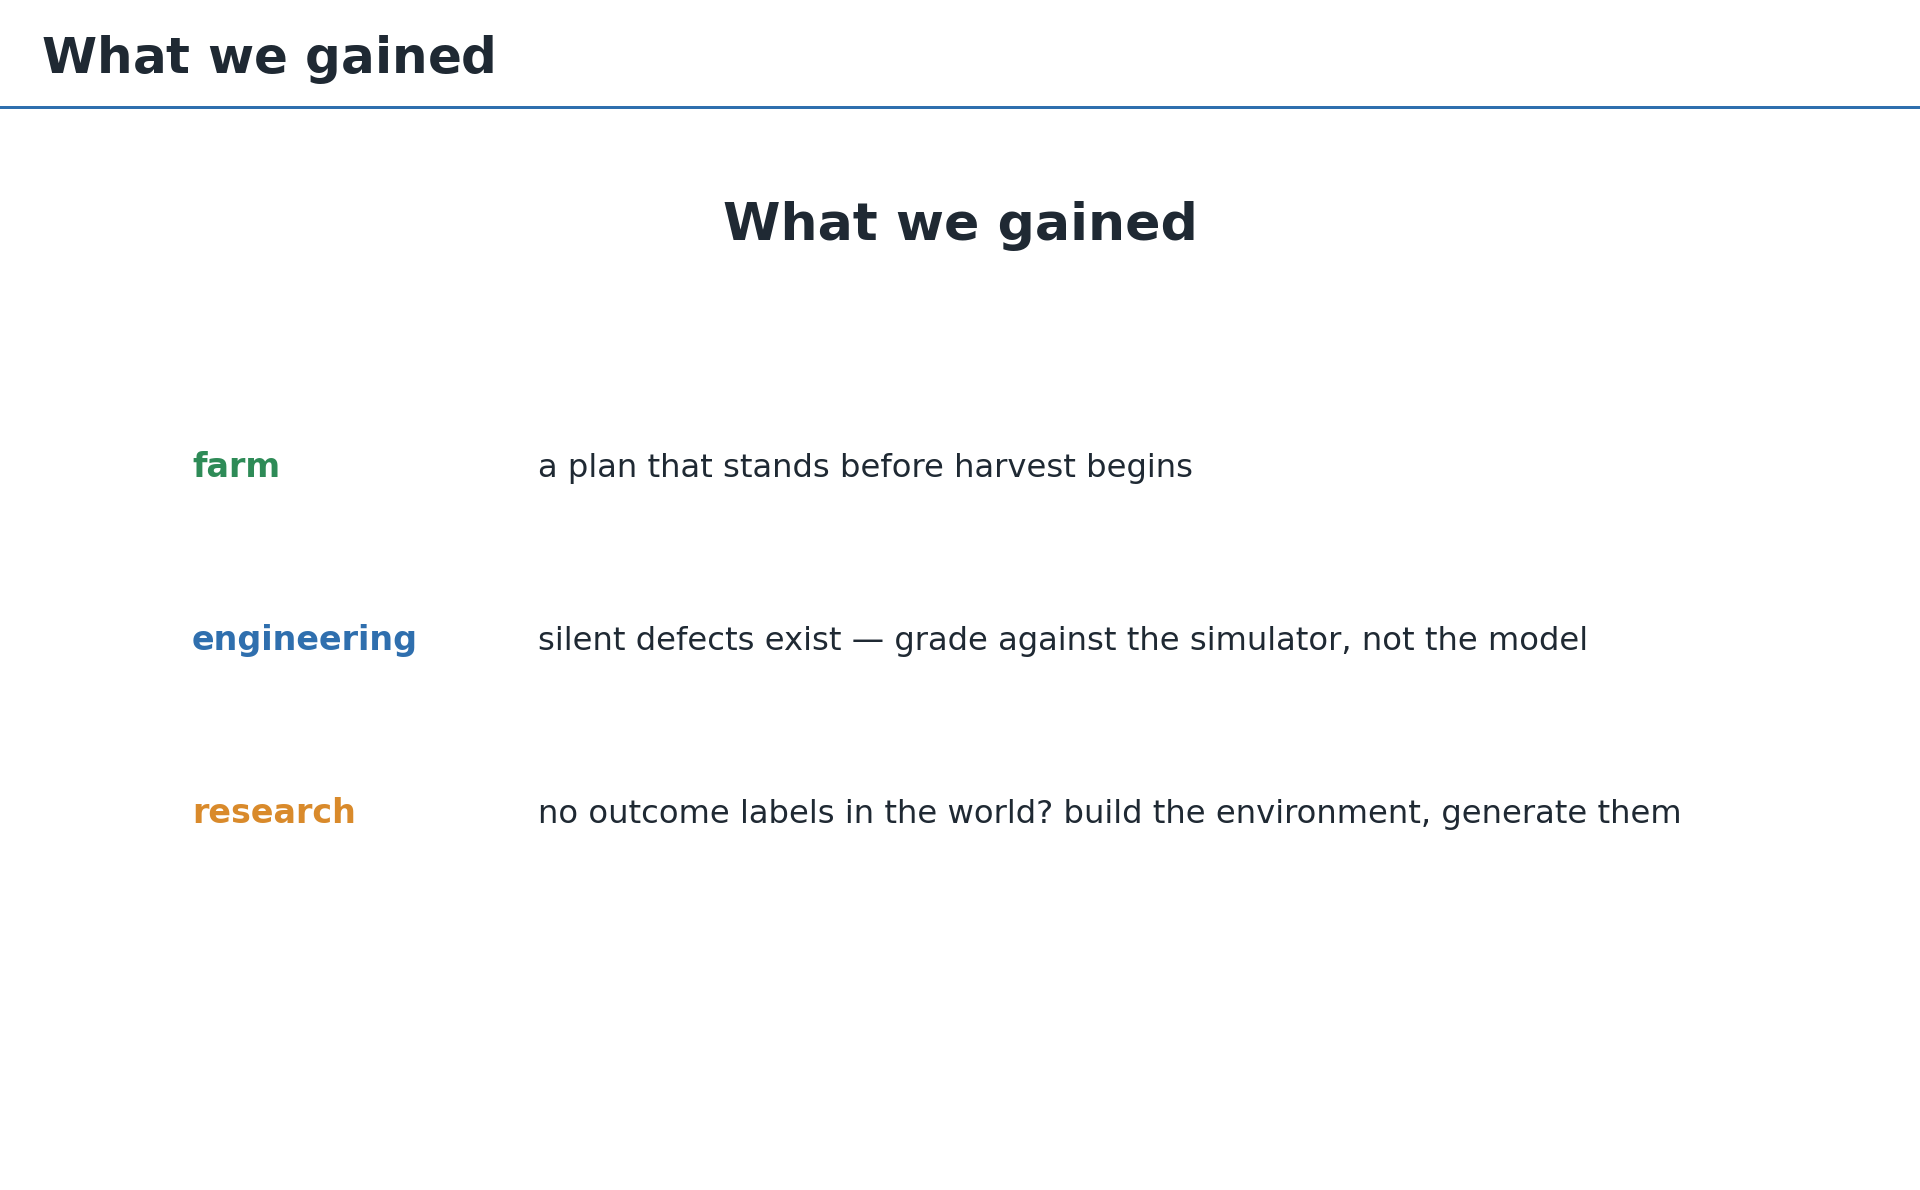
Figure 4. What the project produced, in three directions.
For a farm. A plan that stands before the harvest begins: volume by grade, hours per tree, and what falls to a second pass, with the fruit identified rather than estimated.
For engineering. Silent defects exist. Grade against the simulator, not the model. Six of them here passed every unit check and produced plausible statistics, and the only thing that caught them was running the finished system back through the thing it was built from.
For research. No outcome labels in the world? Build the environment and generate them. The counterfactual structure that follows is not a workaround for missing data. It is something observation cannot produce at all.
What this does not show
Worth being direct about, since the repository is public and anyone can check.
No field trial. The physics constants come from the literature, not from a rig. What the invariant checks establish is that the simulation obeys the physics it was given, not that those constants match a particular orchard.
No leaves or branches in the model. A blocked corridor is decided by neighbouring fruit alone, which underestimates how often the approach is actually obstructed.
The canopy density is an assumption. Fruit diameter and stalk direction came from the detections; the distance between fruit did not. The synthetic canopy is denser than the measured distribution, which pushes neighbour knocks the other way. The size of the two biases was not measured.
No block-level routing. The 500-tree projection multiplies a per-tree plan. It does not route the robot between trees, size a bin, or schedule a shift, and those are not small additions.
No comparison against a human picker. Skill, tooling and orchard practice vary too much for a single number, and published figures have unclear denominators. The report does not claim the system is faster than anyone.
What comes next
The source, the trained weights and the derived data are public under MIT: the extraction pipeline, the environment, the models and the planner. The FRESH imagery is not redistributed, and the extraction notebook reproduces everything downstream from a local copy.
A methods-and-validation preprint is planned on arXiv.
For a live installation the gaps are known and specific. Perception has to supply the detections. Motion control has to execute the plan. The physics constants want fitting to field measurements, the pick cycle wants measuring on whatever arm is actually chosen, and block-level routing has to come after all of that.
None of those change the part that was hard. The environment was the hard part, and it is built.
Source, weights and derived data are public under MIT. github.com/isupernova-io/aipick-harvest-planner
Physics World Models — Building an End-to-End AI Harvest Planner
| Part 1 | Problem & Design | Where the Rules Are Known but the World Is Missing |
| Part 2 | Building the Model | From Physics to 31,960 Labelled Picks |
| Part 3 | Validation & What Comes Next | Grading Against the Simulator, Not the Model |